


Weekly S&P500 ChartStorm - 8 October 2023
This week: market technicals check, presidential cycle, 1987, recession vs no recession, yield curving, small caps, Europe, buybacks, factors over the long-term, energy stocks...

Welcome to the latest Weekly S&P500 #ChartStorm!
Learnings and conclusions from this week’s charts:
As of Friday’s close, a lot of the technical charts are looking much improved (oversold signal, bounce off support, intermarkets improved).
Seasonality is starting to turn, and the so-called “Presidential Cycle” turns bullish again later this year.
The market continues to trade as if there is no recession.
The yield curve is turning higher (which, following inversion, has historically been a bearish/recession signal).
Over the long long-term [from 1866-2019] momentum (tendency of winning stocks to keep winning) has been a winning strategy/factor.
Overall, I would say the background picture remains murky and mixed with recession leading indicator signals, rising rates, and yet also still tight labor market and even some signs of resurgent and resilient growth. In the short-term however, the improvement in the technicals and lurch in sentiment to the bearish side, sets things up for a (short-lived?) rebound.
Chart Of The Week (check out my macro/asset allocation service )
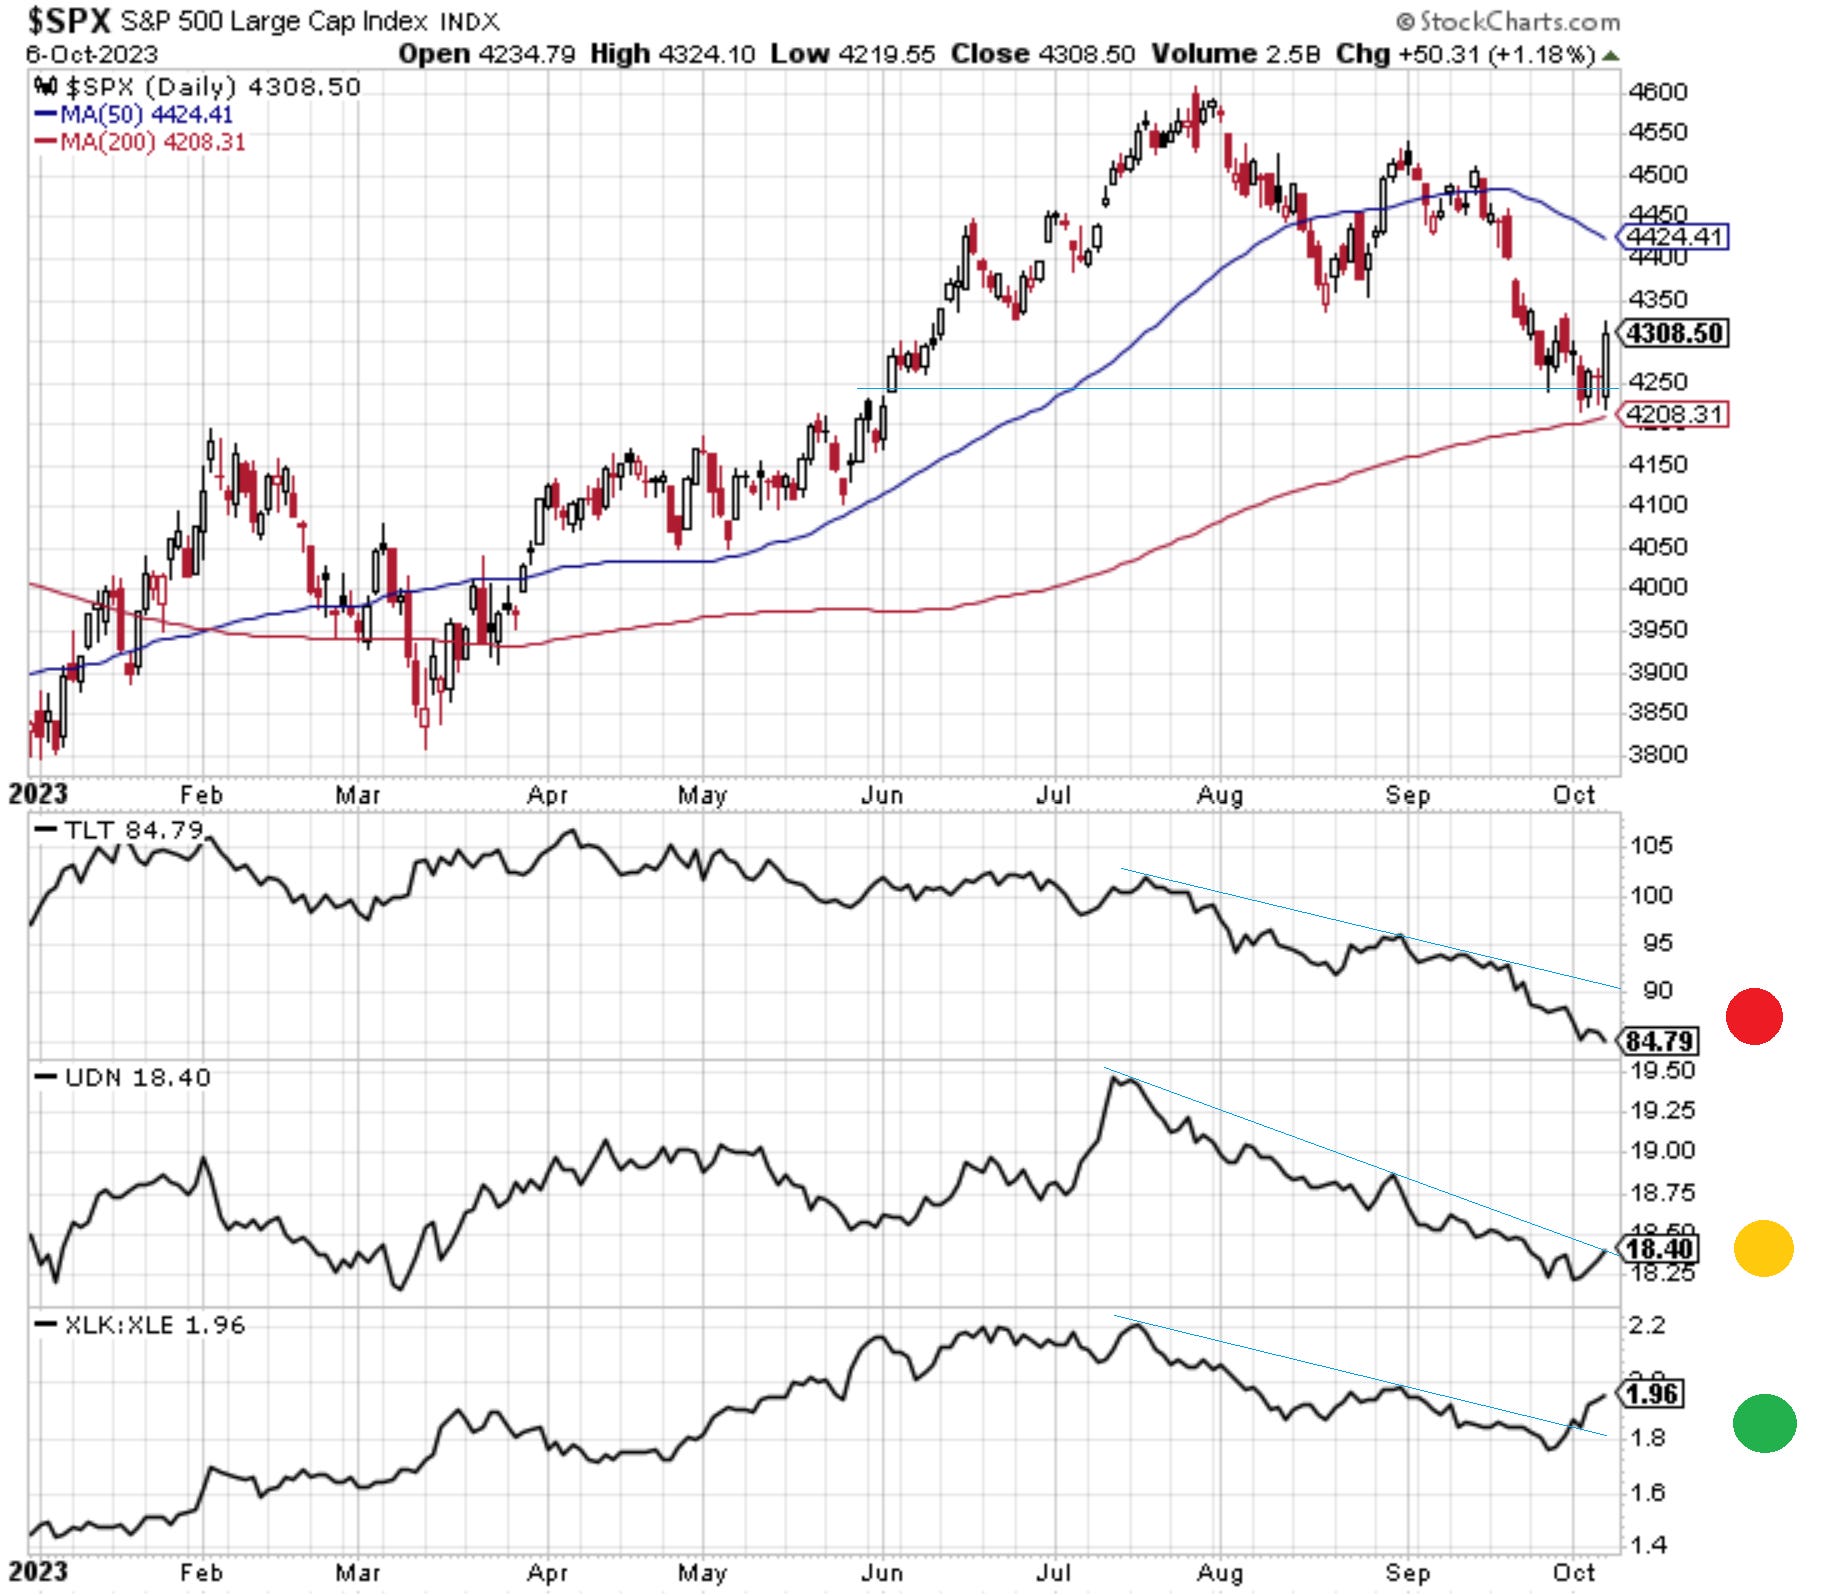
1. Correction Drivers: On first glance, I would have to say this chart is looking much improved. The Index has bounced off a logical support point, oil headwinds are waning following the initial peak in oil prices (albeit the geopolitical situation could change things there), the USD has reached an initial peak [shown inverted], and bonds are trying to bottom. So there is a glimmer that the tightening of financial conditions may relent enough to allow a rally.
Source: @Callum_Thomas using StockCharts
2. Oversold: The 50-day moving average breadth indicator (proportion of stocks trading above their respective 50dma) has turned up after reaching washed-out oversold levels. And again, the index seems to have halted its declines just above the 200-day average and a few inches above a major support line. Knowing nothing else and just seeing this chart would give cause for short-term optimism.

Source: Callum Thomas using MarketCharts
3. Presidential: This is another way of cutting seasonality — tracking how markets trade across the presidential cycle. As it turns out, the presential cycle nearly perfectly picked both the rally off the October 2022 low, and the recent market indigestion. If it continues to work, it would imply a return to uptrend later this year (albeit notice that dip down there? — that’s October 1987).

Source: McClellan Financial Publications
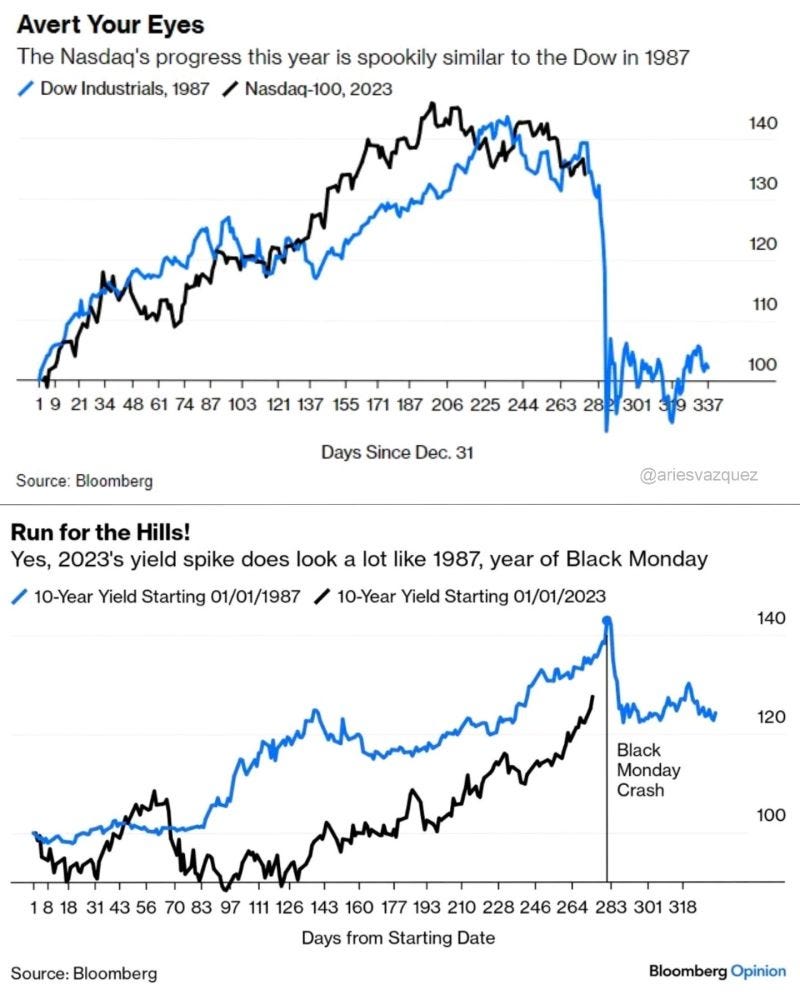
4. Speaking of 1987: Well, firstly I will say I don’t particularly like analog charts because you can fit just about any pattern if you mine the data hard enough — and there are many many failed analog charts, and a lot of the time it’s very click-baity. BUT. I do find this one intriguing because it does have some macro parallels (rising bond yields). It also serves as a reminder that sometimes yes the market cycle unfolds in an orderly fashion and when things turn down you can simply de-risk as the evidence slowly confirms…. but at other times, it happens with a bang and you don’t get a chance to even react let alone reduce risk exposure.
Source: LinkedIn
5. No Recession = No Problem: The market continues to trade like there’s no recession. And to be fair, a lot of the US data continues to turn in like there’s no recession (as yet). The interesting implication from this chart is that if there is no recession, it lays out the path higher, but also: if there is a recession — where things likely head (down to that bold green line).

Source:
report6. Yield to the Curve: As I highlighted with the Global Equities Yield Curve Signal chart, it’s not necessarily the yield curve inversion that gets you, but the subsequent steepening. So in terms of bear/recession signals, watch out for a sustained break higher in the yield curve (but also be mindful, that like many indicators, it is no silver bullet, and hence can’t be a standalone signal).
Keep reading with a 7-day free trial
Subscribe to The Weekly ChartStorm to keep reading this post and get 7 days of free access to the full post archives.