


Weekly S&P500 ChartStorm - 6 April 2025
This week: surveying the damage and weighing up the next steps...

Welcome to the latest Weekly S&P500 #ChartStorm!
Learnings and conclusions from this week’s charts:
Multiple indicators point to a technical trend change (bear market).
Multiple short-term (sentiment/technical) indicators point to a rebound.
Valuations have come down but are still far from cheap.
Recession risk is rising, and the Fed may be slow to step in.
Global fund flow feedback loops are reversing (out of US markets).
Overall, I’d say the obvious answer is we rally next week and make new lows later. The technical and sentiment conditions are ripe for a rebound, but the fundamental/macro and value factors still look early in the process (of bear market). It would take something very special and surprising to turn this sinking ship around at this point. So rally-chasers can try their luck, but investors should exercise patience and caution in searching for generational buying opportunities (not yet).
ICYMI: Global Asset Allocation Outlook - Q2 2025 [video]
1. Technicals: Let’s start with a quick survey of the damage. On the downside the 50-day moving average is moving lower and getting close to a “death cross” (where the 50 crosses below the 200 — a rough indicator for detecting primary trend changes), also as of Friday the 200-day moving average has now peaked (moving lower on the daily chart). We’ve also blown through 3 key support levels (~5600, 5400, ~5200), and breadth has been on a deteriorating trend. Overall the technical prognosis is very weak (and was weak even prior to tariff day).
On the upside: 50dma breadth is getting oversold, 5000 is likely to serve as a strong support level if tested, and going back to 1964 there has never been more than 2 days in a row of declines exceeding -4% (it’s more common to see a rebound following 2 back-to-back days of large declines, and 5-10% gains the next day are not uncommon; large up/down moves tend to cluster).
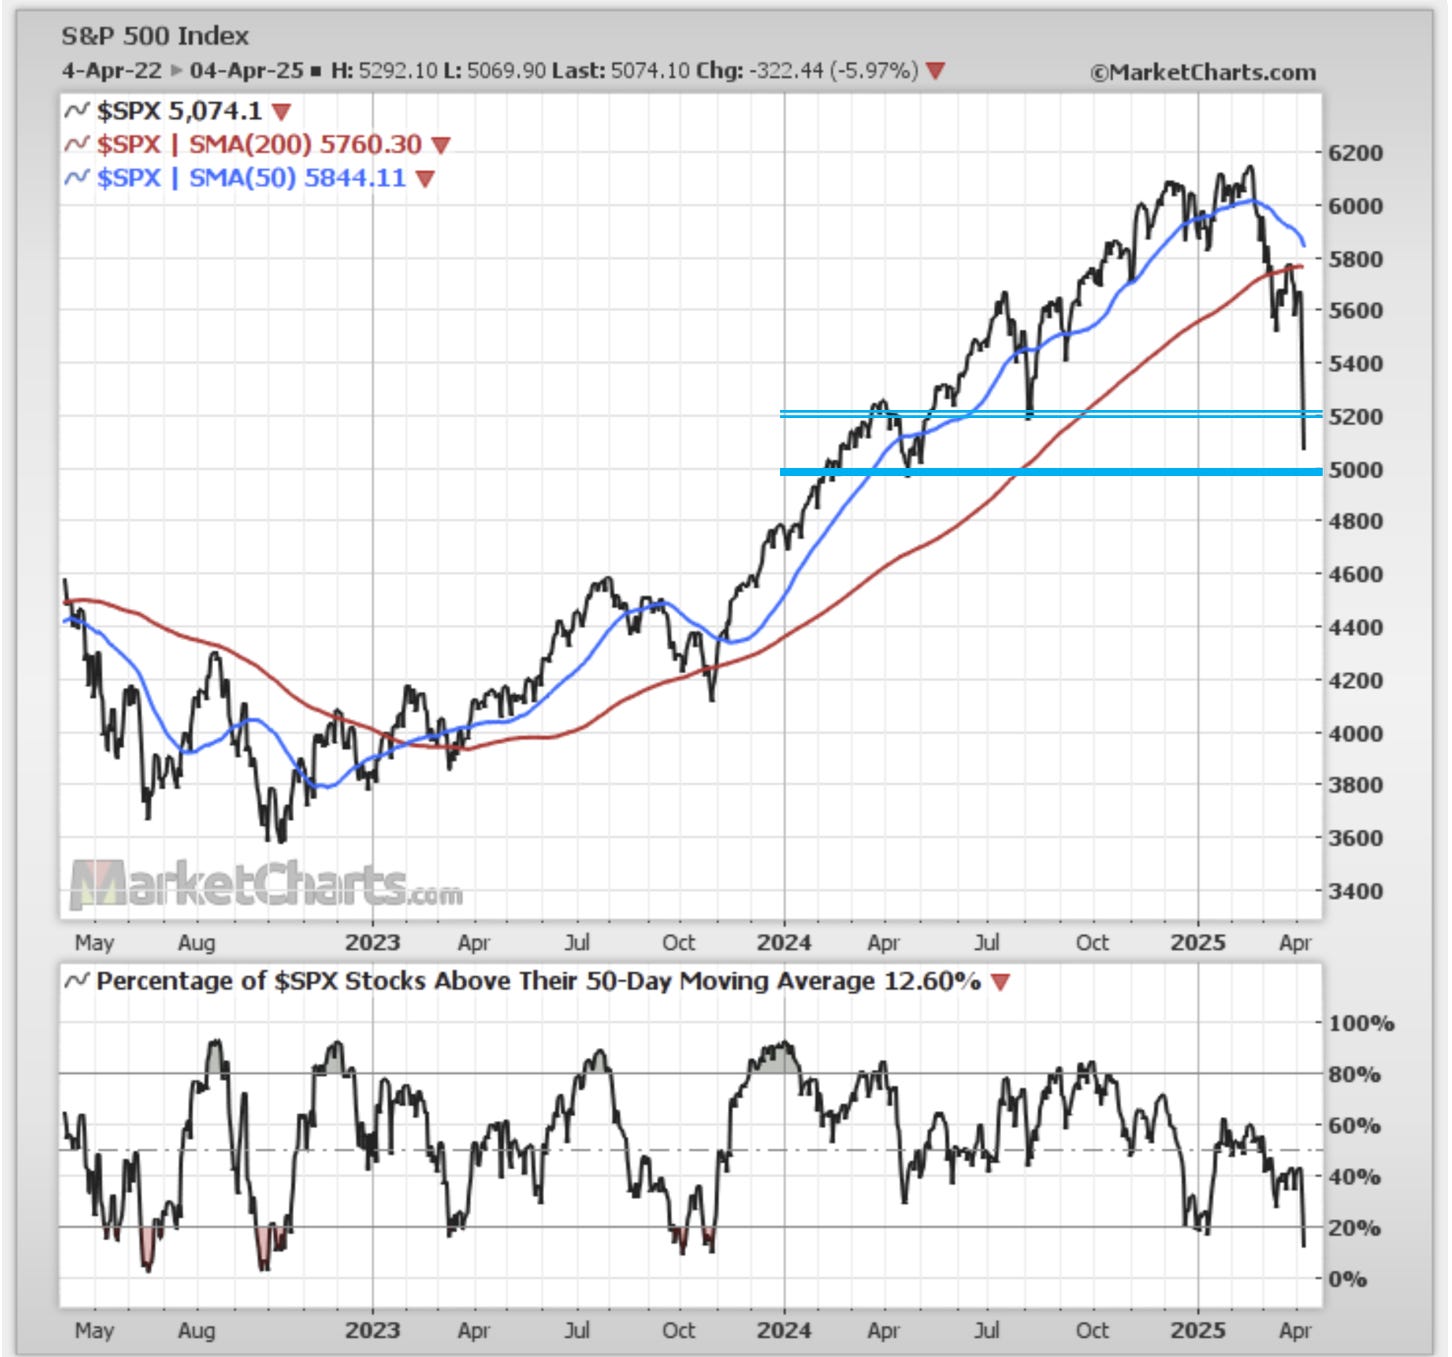
Source: MarketCharts
2. Bearish Sentiment: The surveys are about as bearish as it gets, and that always makes for fertile grounds for rally. The only caveat would be that there is some inconsistent info on the sentiment front, there seems to be ample appetite to get in and buy the dip (which can be self-fulfilling short-term). The other thing is our favorite indicator, the Euphoriameter is still well north of where it needs to be to get structurally bullish, even after Friday. So really the key takeaway is that anything that looks bullish at the moment is really only good for a short-term rally, and investors looking for generational buying opportunities are probably going to need to be patient and let this thing play out.
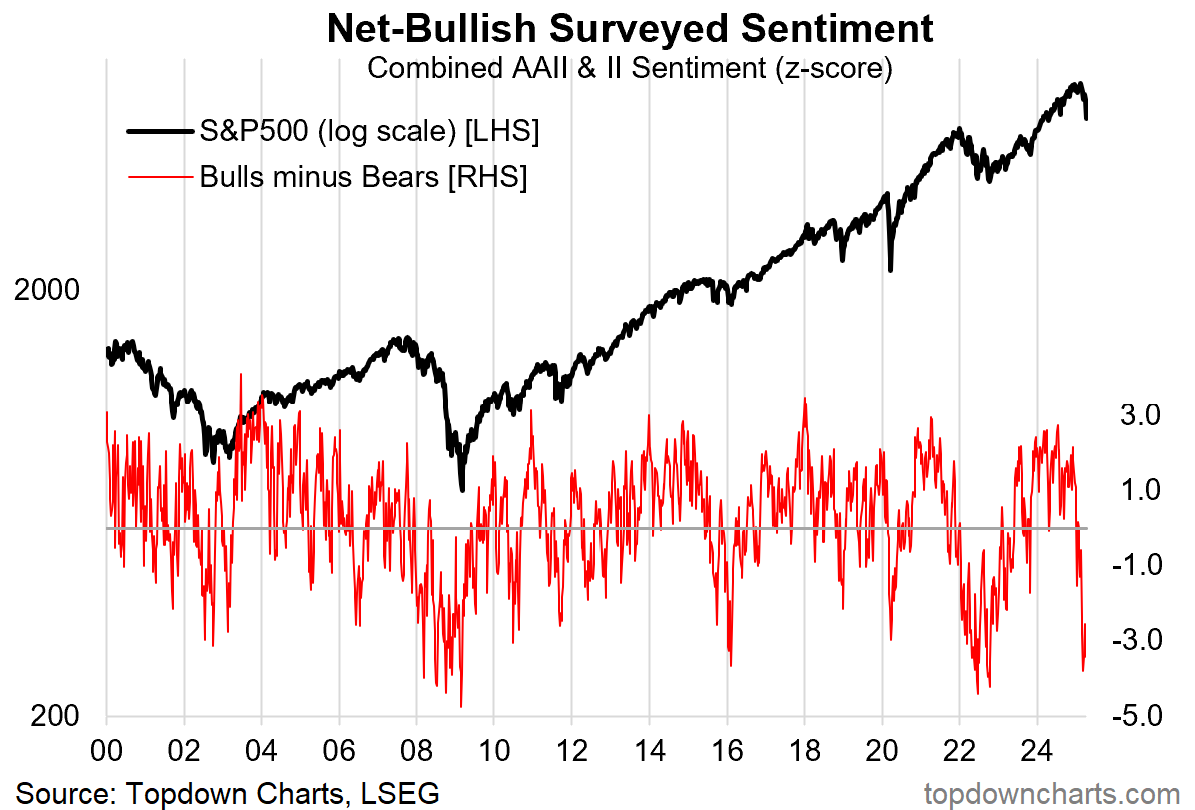
Source:
3. Big Value in Small Caps: This is a great one, it shows the long-suffering small caps sinking to valuations just slightly cheaper than the March 2020 lows. It also shows large caps making quite a big reset to be sure, but I don’t think anyone would really call that side of the market cheap just yet.
Keep reading with a 7-day free trial
Subscribe to The Weekly ChartStorm to keep reading this post and get 7 days of free access to the full post archives.