


Weekly S&P500 ChartStorm - 30 March 2025
This week: technicals and tech check, changing tides, credit spreads...

Welcome to the latest Weekly S&P500 #ChartStorm!
Learnings and conclusions from this week’s charts:
The S&P500 failed to retake the 200-day moving average.
The next big test is whether current support levels can hold.
Semiconductor sales look set to slow significantly.
Multiple market cycle indicators are turning down from peaks.
Basically it looks like the market tides are going out.
Overall, as most muse on what may come in the week ahead (tariff day is coming), I’ve opted to stay focused on what’s observable, and zoom out with an emphasis on “market tides” — how some of the slower-moving, longer-term market cycle indicators are tracking (not good); because this is the important background context upon which all the day-to-day news is happening against. But don’t take it in a negative or pessimistic sense, it’s about learning to love the cycle; to be a victor not a victim of the cycle, and above all to keep perspective.
ICYMI: 10 Charts to Watch in 2025 [Q1 Update]
1. Test Failed: The S&P500 attempted and failed to retake the 200-day moving average (+overhead resistance around 5800). This is a very bad sign indeed — the next test will be to see if support can hold around the current levels. Breadth meanwhile also remains on a deteriorating path.
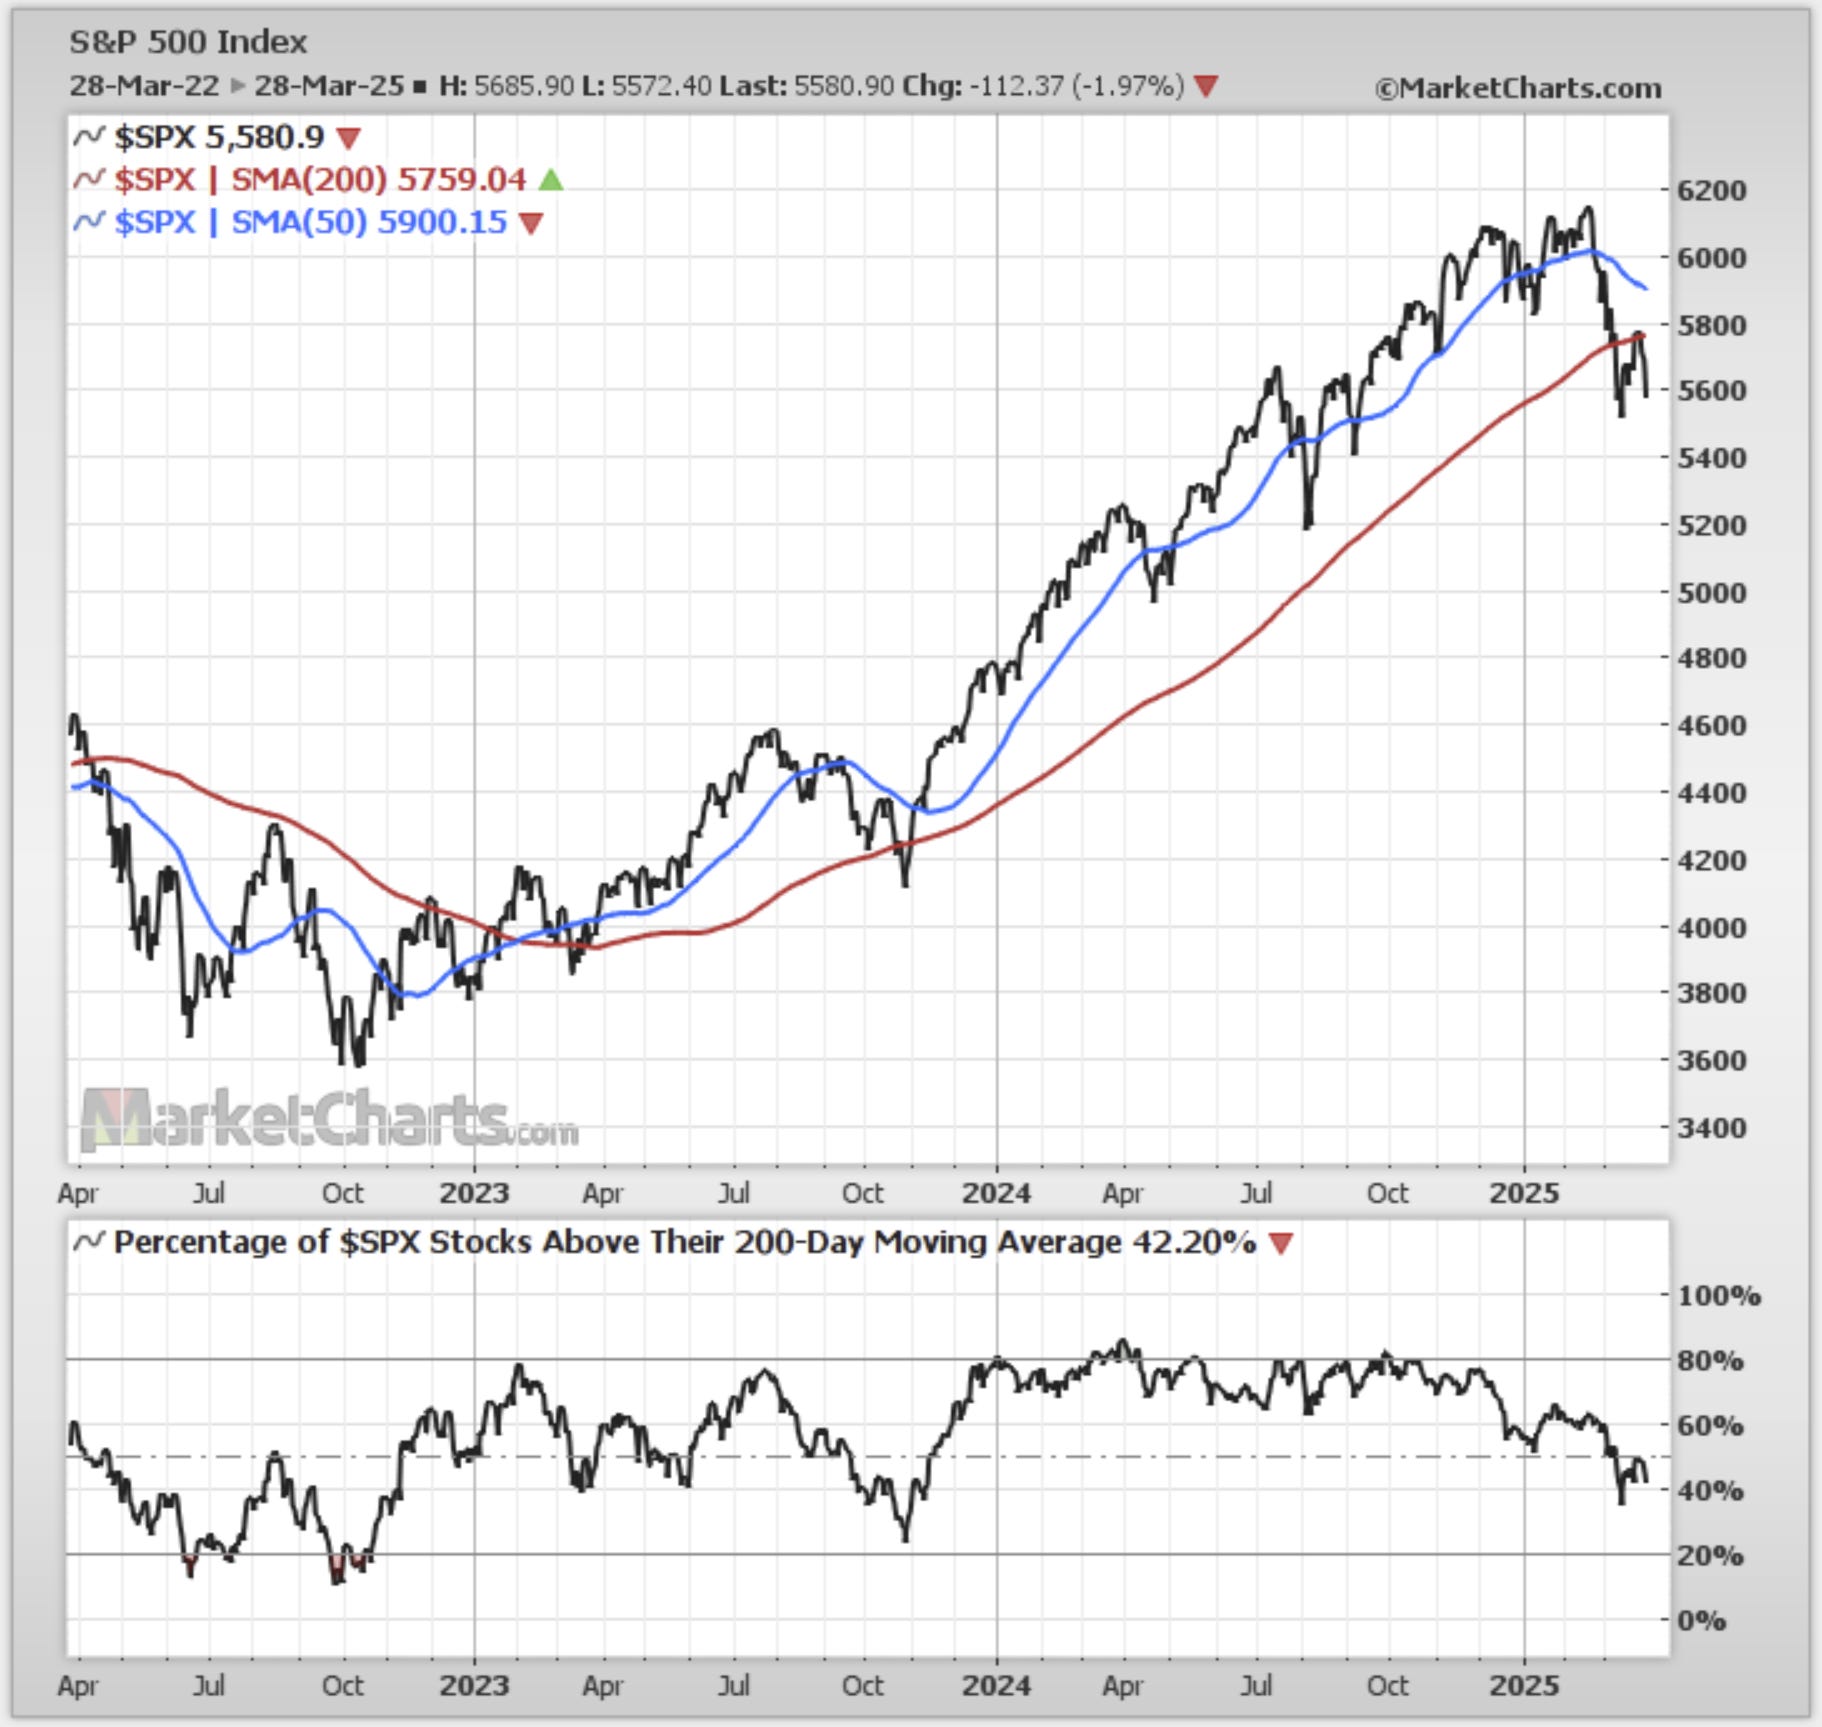
Source: MarketCharts
2. Tech Lag: Tech lags tend to linger. Given the prior excesses in tech stocks (flows, valuations, hype) + how things usually unfold, the risk is tech goes lower for longer.
Keep reading with a 7-day free trial
Subscribe to The Weekly ChartStorm to keep reading this post and get 7 days of free access to the full post archives.