


Weekly S&P500 ChartStorm - 23 March 2025
This week: technical check, seasonality, corrections vs bears, buy the dip, uncertainty, hype, conditional volatility, analogs, margin debt flows, ultimate value indicator...

Welcome to the latest Weekly S&P500 #ChartStorm!
Learnings and conclusions from this week’s charts:
The S&P500 broke its 4-week losing streak with a +0.5% gain.
Yet it remains below the 200-day moving average.
Traders have been buying the short-term oversold dip.
Even if it’s a bear market we might get a seasonal bounce.
(but) There are multiple medium/longer-term downside risk signals.
Overall, I can sum it up best as saying: what I am seeing is that a lot of short-term tactical indicators are oversold/buys (partly sentiment, partly math), but all of the medium-longer term indicators are still bearish/in risk-alert mode and have not even close to reset anywhere near buys yet (for the longer-term minded or cyclically-aware investors).
1. Life Below 200: Last week the S&P500 managed to eke out a +0.5% gain, nothing spectacular, and realistically; basically flat. But that did break a 4-week losing streak, and has the market sitting just above that ~5600/5650 support area.
That’s the upside. The downside is the 50-day average tells us the short-term trend is down (downward sloping 50dma line), and the index being below the 200-day average (and over 50% of constituents below their respective 200dma) is a foreboding fact —as Paul Tudor Jones has been attributed as saying: "Nothing good happens below the 200-day moving average."
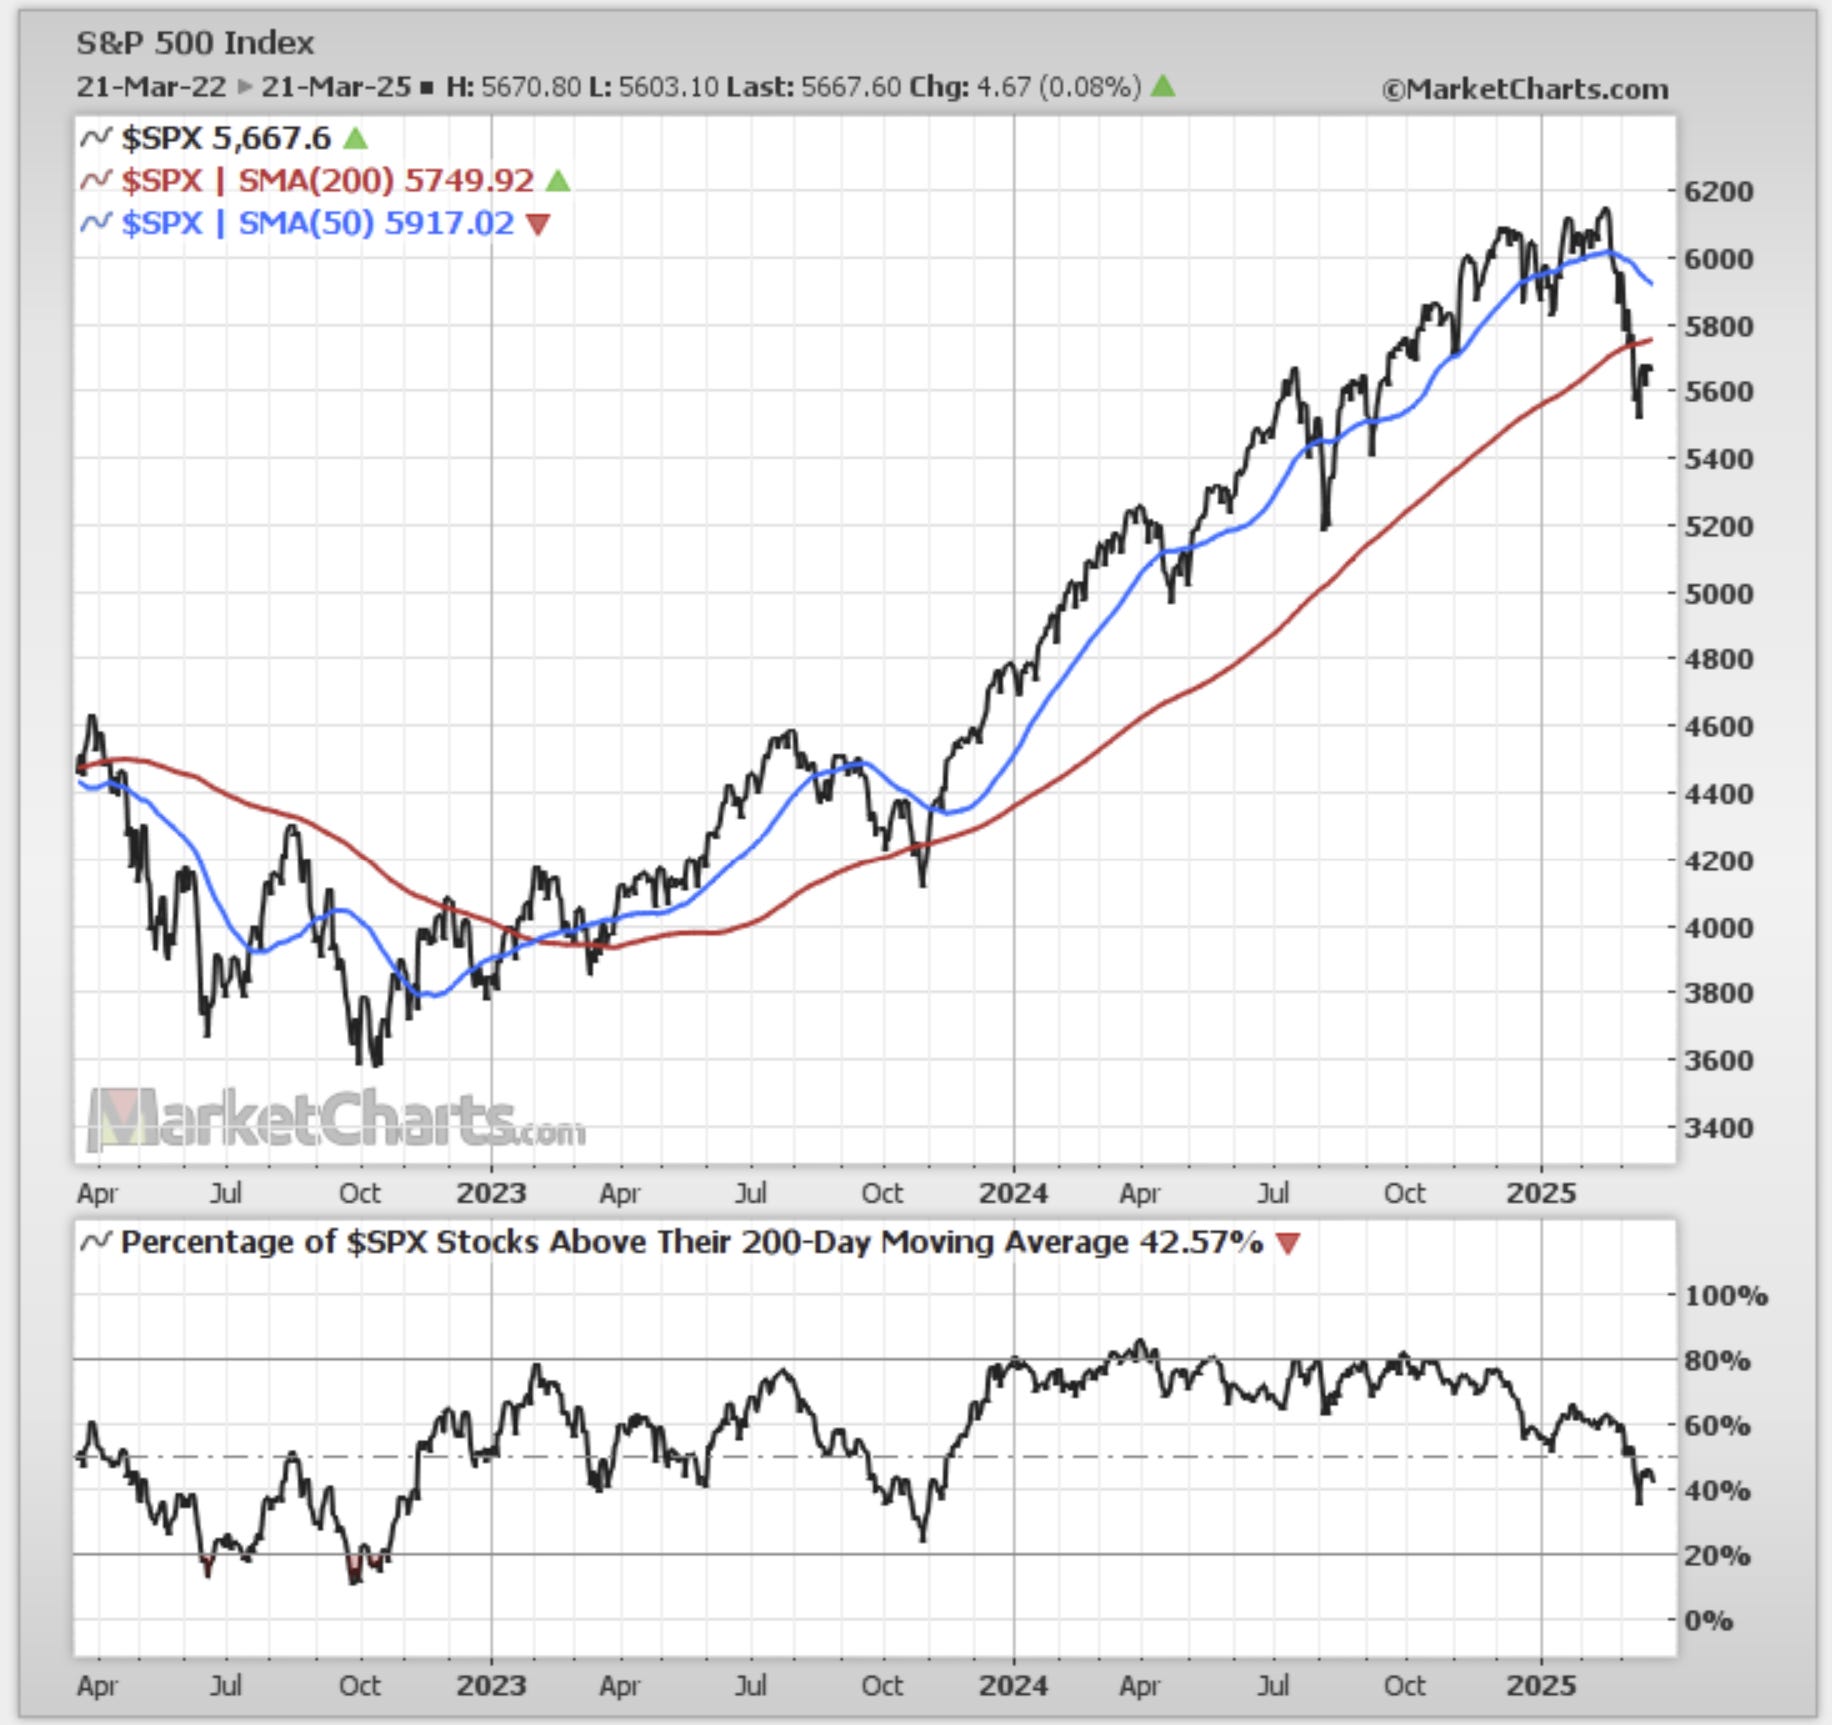
Source: MarketCharts
2. Bear Market Seasonality: And that reminds me of a piece of analysis I did — looking at how seasonality works in bull markets vs bear markets. If you use price <200dma as a proxy for bear market (i.e. using the 200dma as a trend detector), and conduct the usual seasonality analysis only on that data here’s how it looks (not good) [n.b. the bright red line shows how seasonality was in years that ended down YoY, which is not something we can know in advance, but we can observe price vs 200dma daily; the darker red line].
On the upside, maybe we do get a seasonal bounce here (but only as a brief respite if we stay below that 200dma).
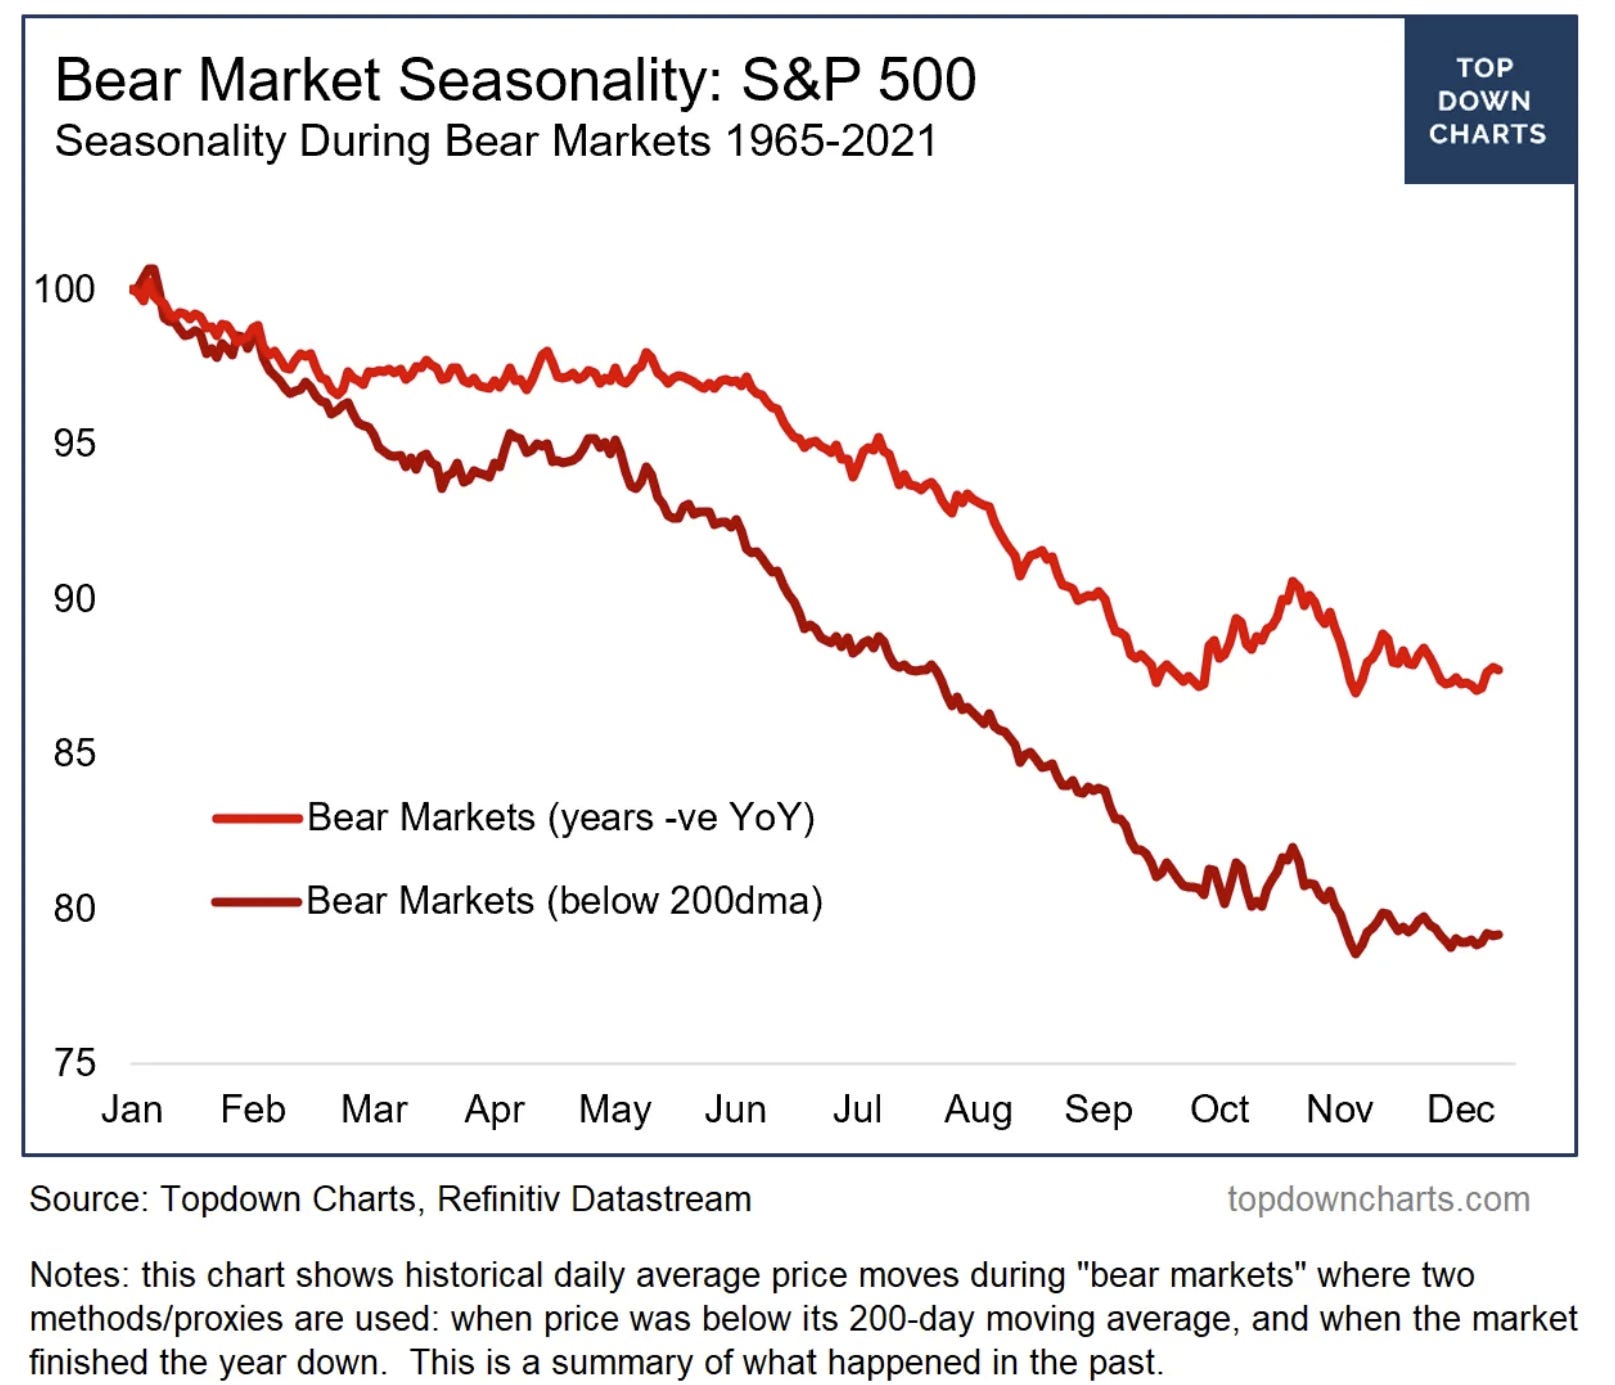
Source: Chart of the Week - Bear Market Seasonality
3. Recession Trading: Here’s another angle on it, and quite a useful way to think about how markets work — you have an initial correction as some kind of catalyst or trigger meets a market ready to correct. We could describe that as the market anticipating worse times ahead. If worse times (e.g. recession/crisis) precipitate then the market heads further lower with good reason, but if there is no good reason for the market to head lower (i.e. no recession, no other fundamental deterioration or shift in macro/monetary dynamics) then it probably finds its feet and gets back on track.
Keep reading with a 7-day free trial
Subscribe to The Weekly ChartStorm to keep reading this post and get 7 days of free access to the full post archives.