


Weekly S&P500 ChartStorm - 21 April 2024 [free version]
This week: drawdown in perspective, technical check, risk flags, overconfidence, insiders out, buyback yield, equal-weighted, M&A achievement, tax rates...

Welcome to the latest Weekly S&P500 #ChartStorm! [free version]
Learnings and conclusions from this week’s charts:
So far the market correction has seen a -5.5% drawdown.
Technicals remain tenuous (bearish divergence, break of the 50dma, breach of short-term support).
The correction comes from a starting point of very bullish sentiment.
Historically equal-weighted has beaten cap-weighted.
Companies are apparently getting better at M&A.
NEW: Education Section — Investment Strategy
In response to reader feedback, questions, and my general quest for elevating quality and usefulness, I recently launched an Education Section on the Topdown Charts entry-level service website.
Recent articles have covered issues such as:
Concepts and methods behind my valuation indicators
How to navigate the market cycle: detect risks vs opportunities
Practitioner perspectives, current takeaways, nuances and pitfalls
I’m currently working on perhaps one of the most important articles so far (applying valuation signals + market timing methods in a global cross-asset setting) — so be sure to bookmark that page or subscribe as a free subscriber to get a copy when I publish it.
1. Markets in Turmoil: As of Friday’s close the drawdown so far for the S&P500 has been -5.5% off the closing high — albeit still positive YTD, and still above the 2021 high. Taking it into historical context, it’s only registering as noise at the moment..
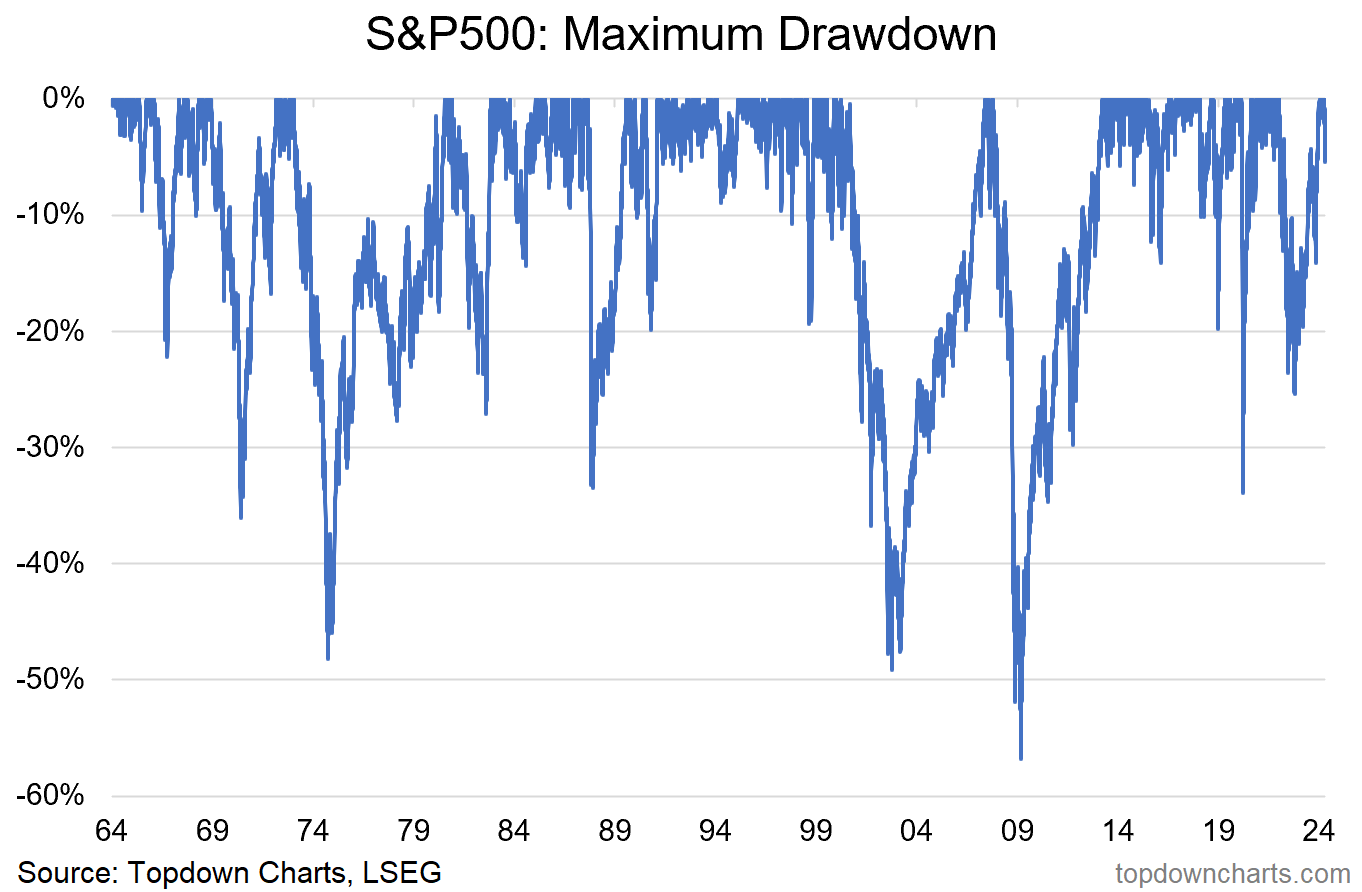
Source: Topdown Charts Topdown Charts Professional
2. Where-to From Here? Taking a glance at the technicals, given the previous bearish breadth divergence (lower high on the breadth indicator), drop below the 50-day moving average, and breach of short-term support around 5000 — I would say there is a decent chance of the index revisiting the 4800 level (albeit likely with a bounce along the way).
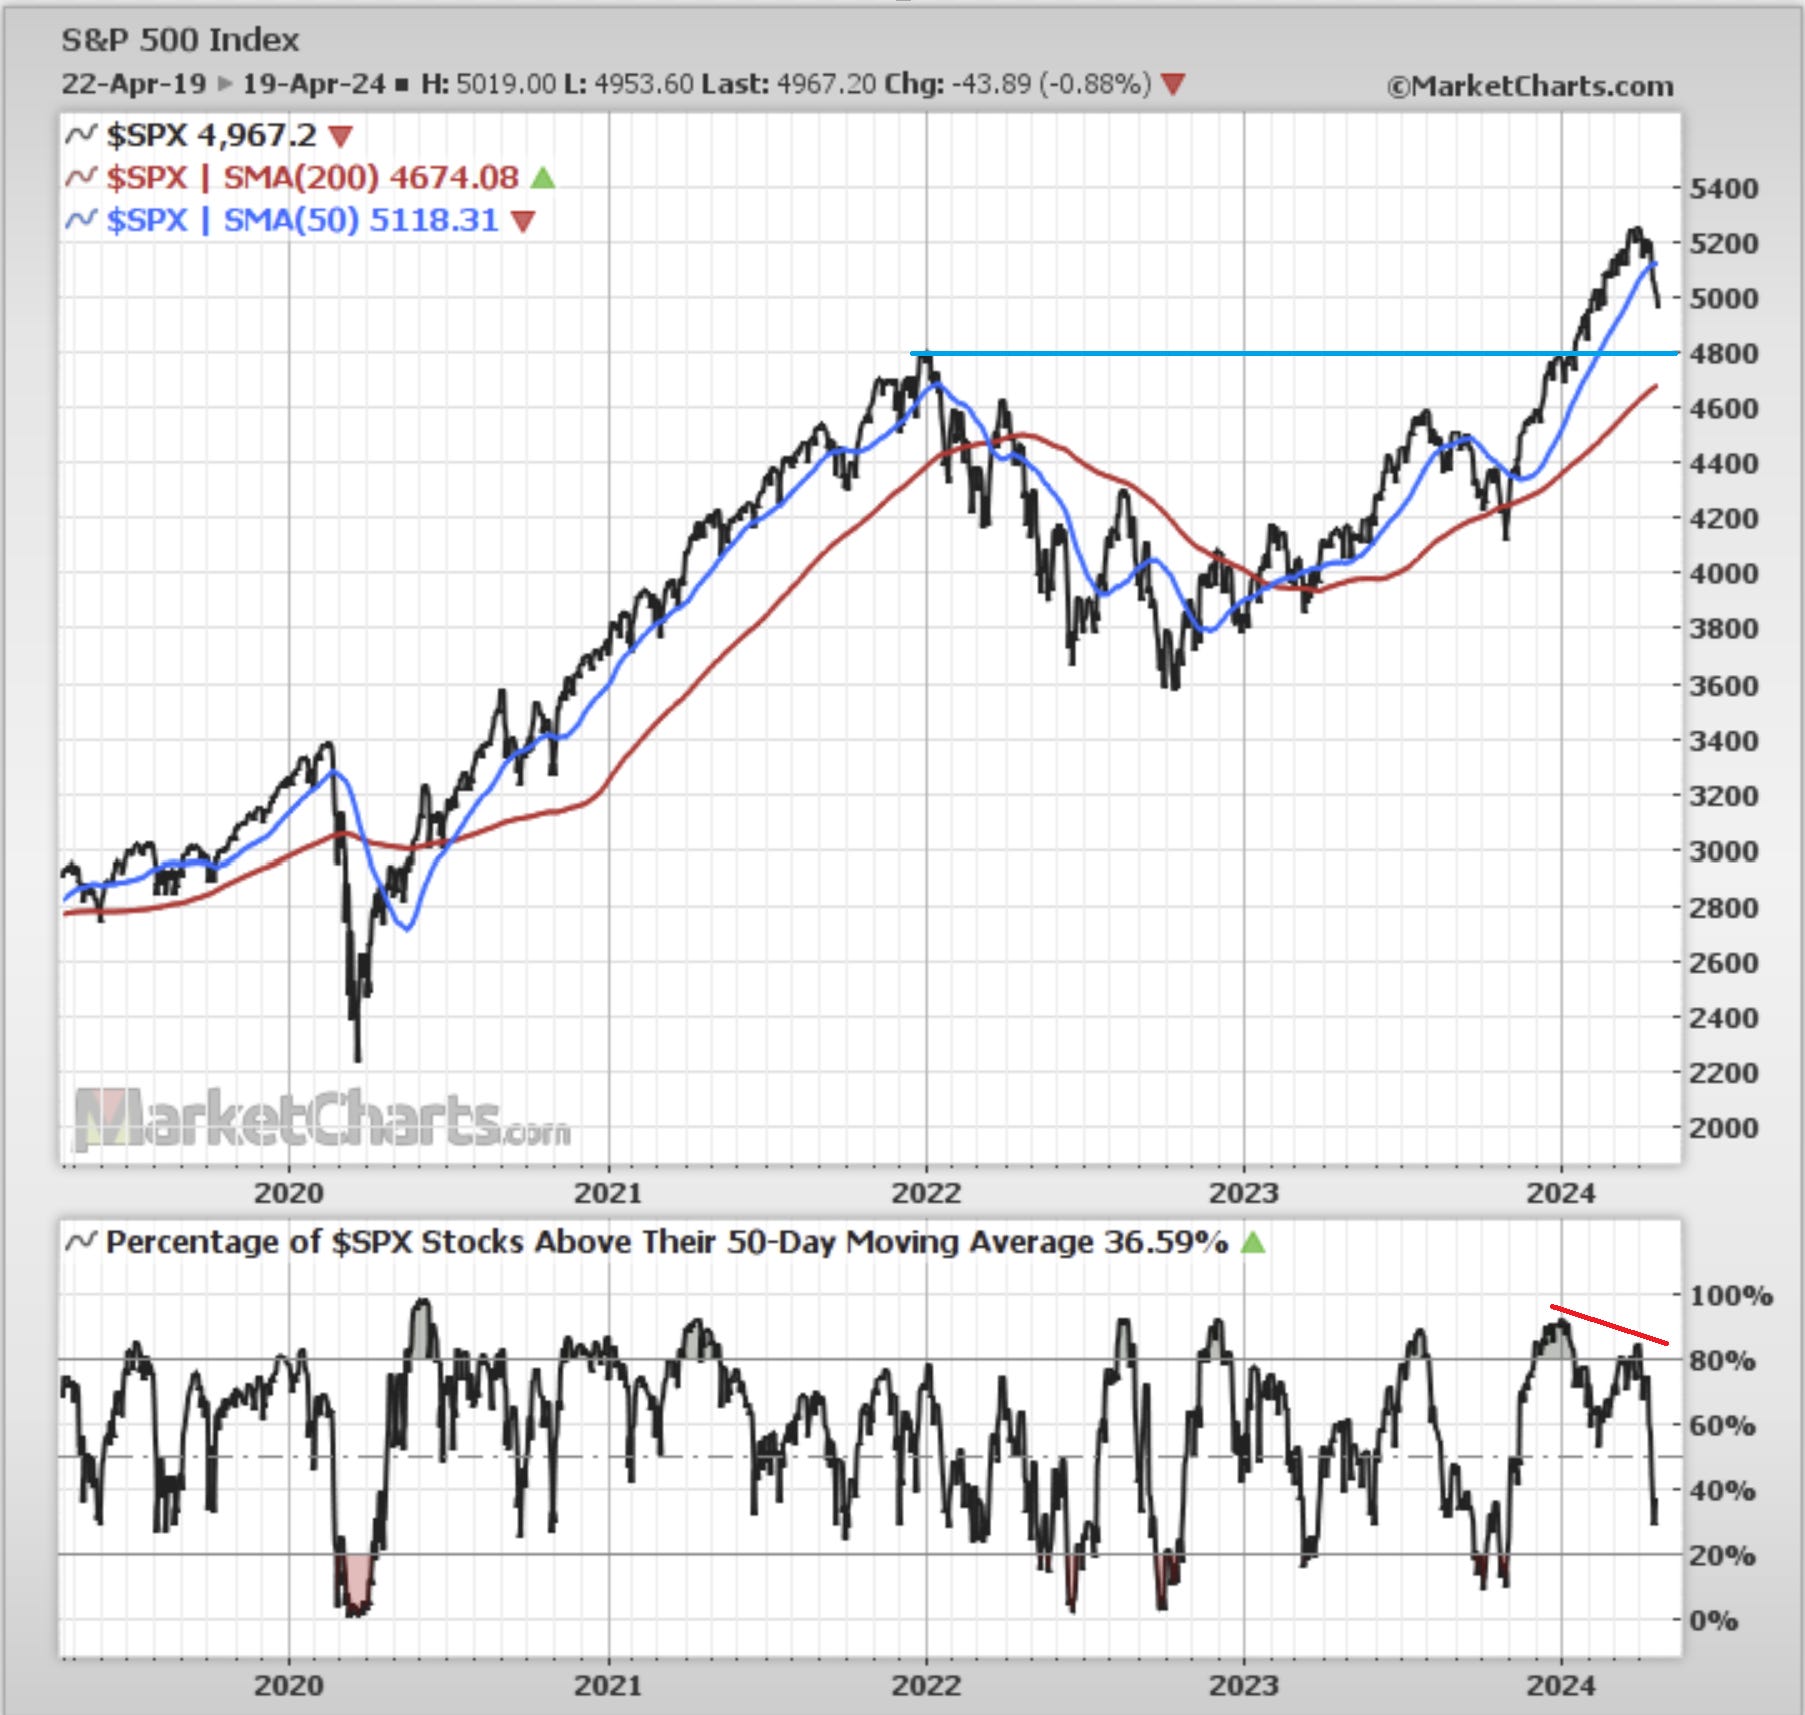
Source: @Callum_Thomas using MarketCharts charting tools
3. Sentiment Shifts: I previously highlighted this one as a short-term topping signal, a risk flag — and hey it worked! But now the question is: has it reset enough yet? Probably not, and so far the surveys haven’t moved much yet either. Part of the reason we call it a “correction” when the market falls is that it’s about correcting excess optimism, consensus thinking, and stretched valuations. It becomes a “healthy correction” when and if it corrects these unsustainable conditions without damaging the underlying bullish trend (…watch this space!)
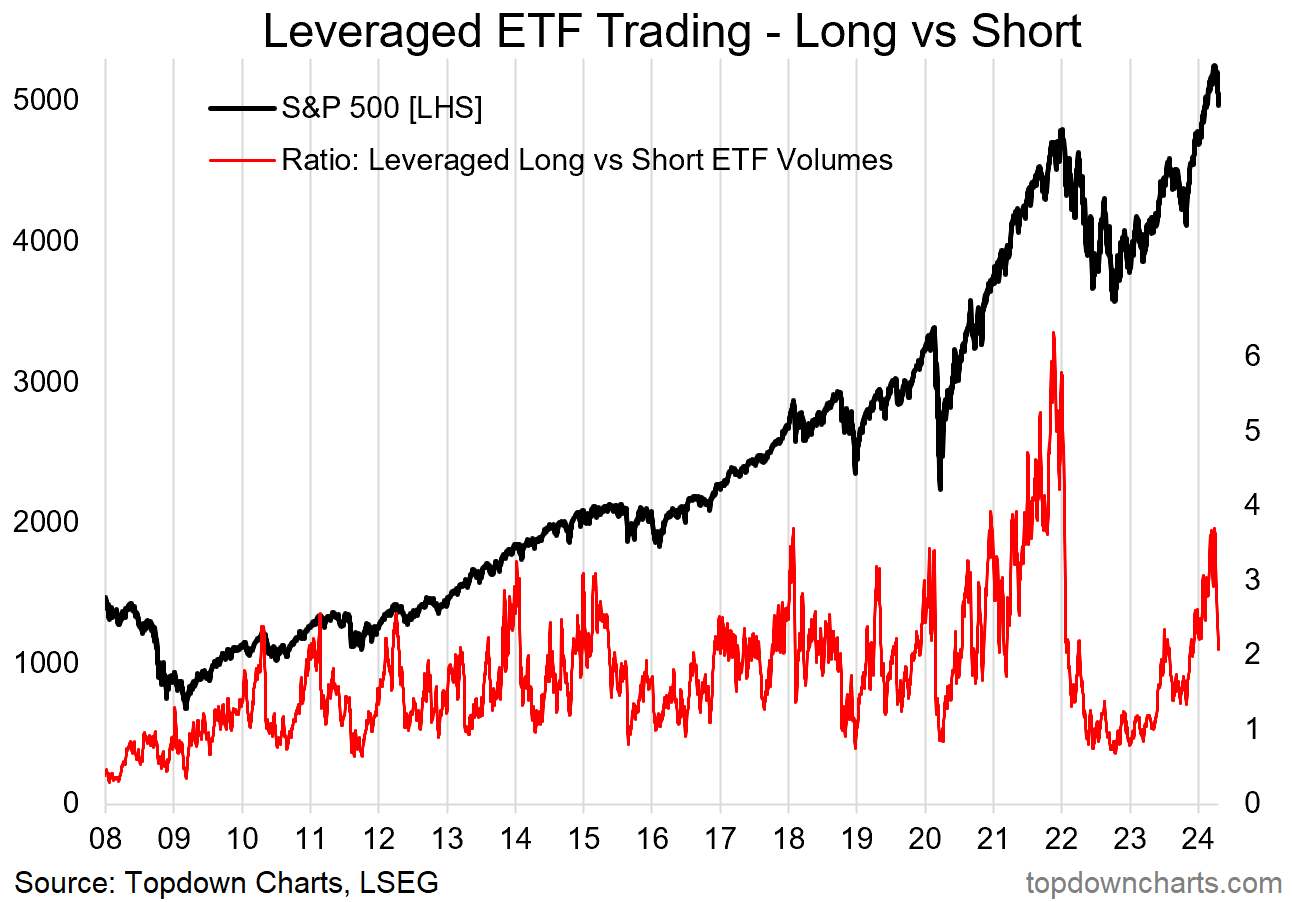
Source: Topdown Charts Research Services
4. Great Expectations: Echoing those points, this chart shows consumer surveyed expectations of the chance of higher stock prices. Clearly the mood is (or at least was) bullish. This was echoed in the NY Fed survey (which showed respondents the most bullish since mid-2021). Various other surveys (e.g. AAII) also showed heavy bullishness recently (50% bullish at the end of March).
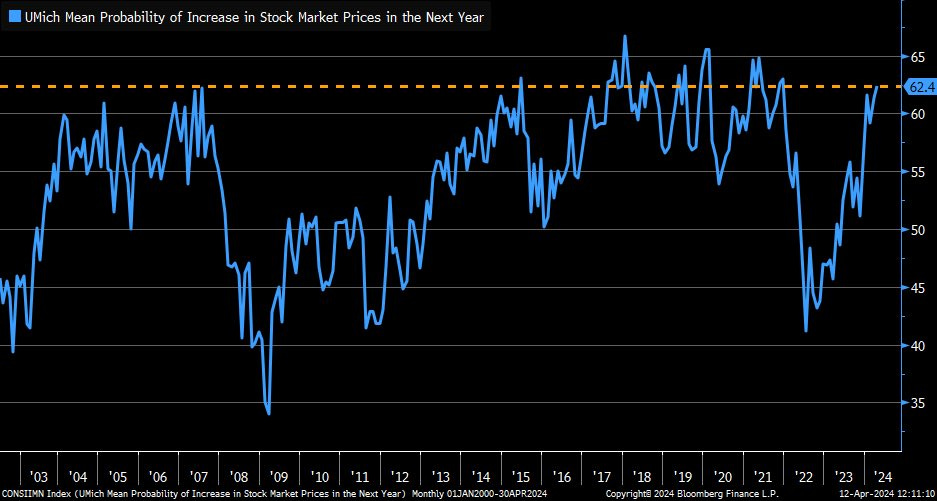
Source: @LizAnnSonder via TKer by Sam Ro
5. Not Buying It: Recent data showed a multi-year low in the proportion of publicly traded companies seeing net-buying by insiders. Either they think the price is too high, or they see red flags internally, or perhaps even just have less cash than usual to deploy on stock purchases… generally it’s not a healthy sign.
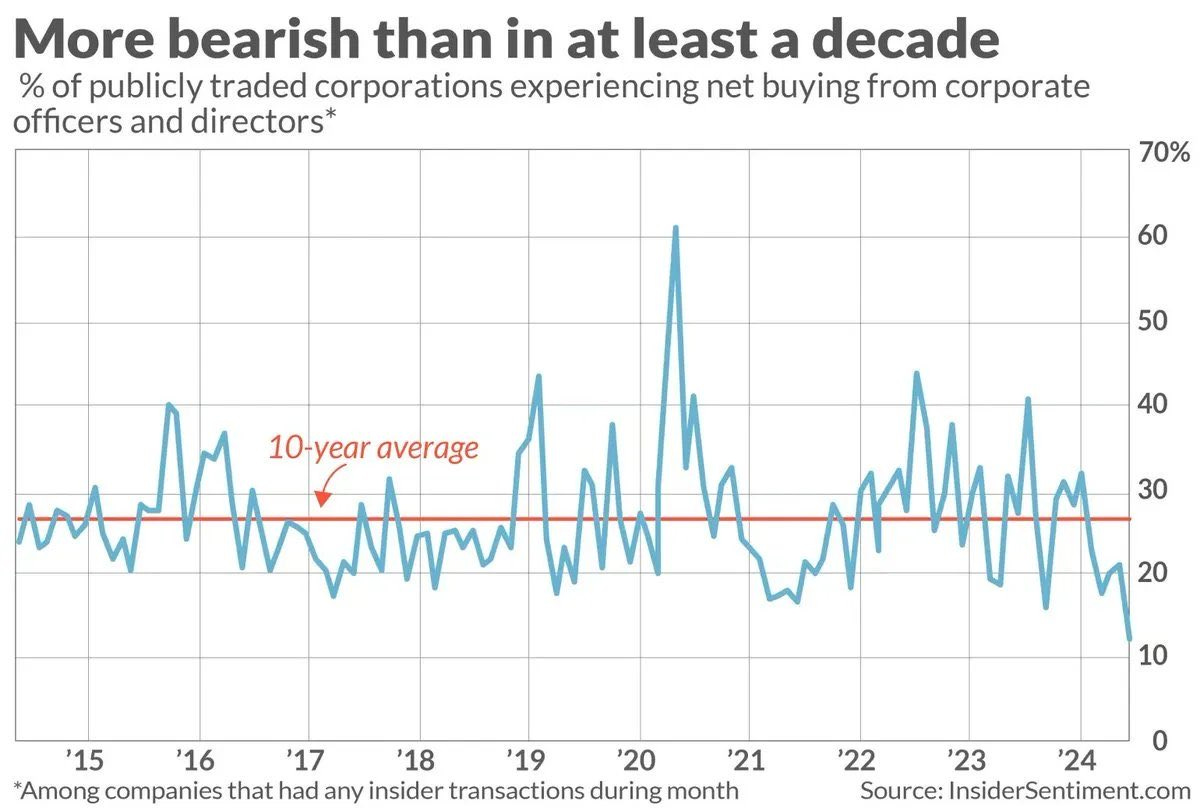
Source: @MichaelAArouet
6. Issues: After surging during the IPO boom and SPAC frenzy of 2020/21, the total number of issues traded has peaked and is steadily declining.
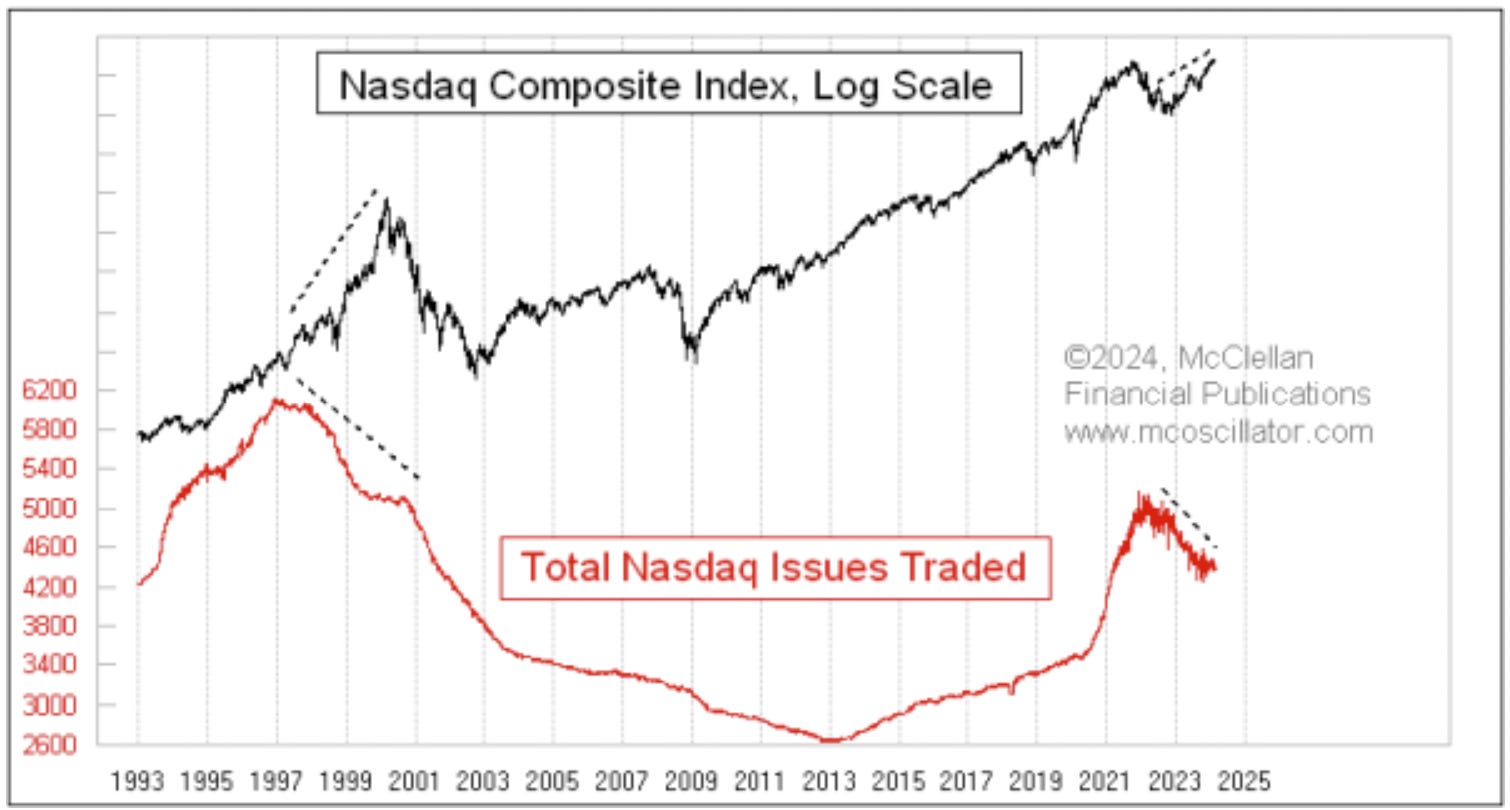
Source: Total Number of Stocks Is Shrinking
7. Buyback Yield: If you add on the effect of buybacks to the dividend yield, it significantly improves the level (vs dividends only), but still leaves the overall yield at the bottom end of the historical range.
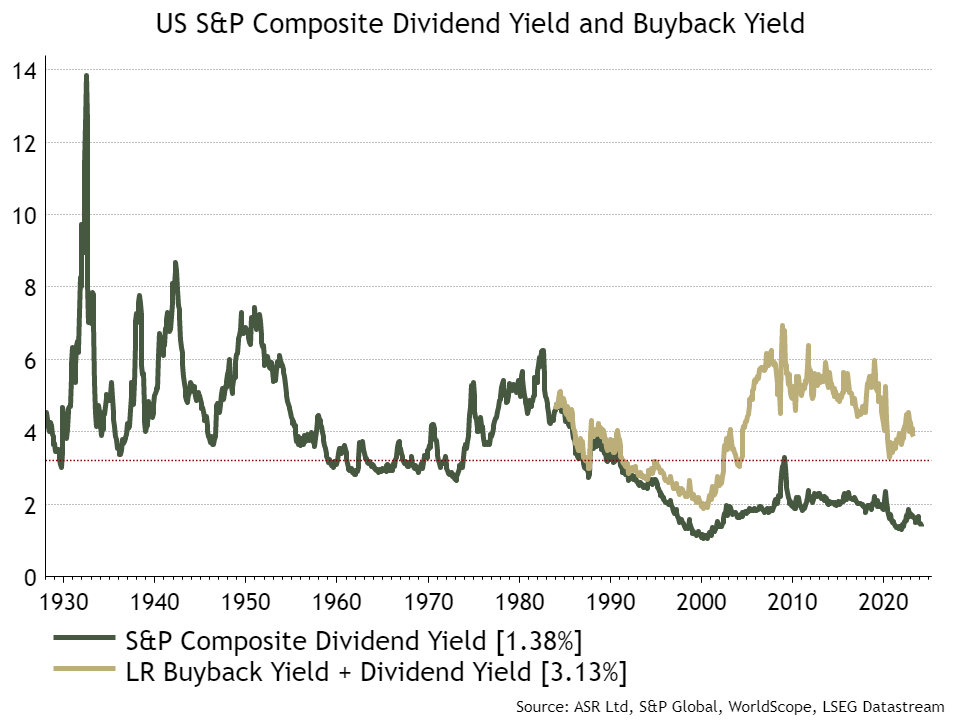
Source: @IanRHarnett
8. Created Equal: There has been much talk in recent years of the merits of market-cap based indexes (particularly during the rise and rise of passive investing), but despite the recent dominance of the top stocks, mag-7, FAANG, etc — it turns out over the long run the equal-weighted index has outperformed the cap-weighted index.
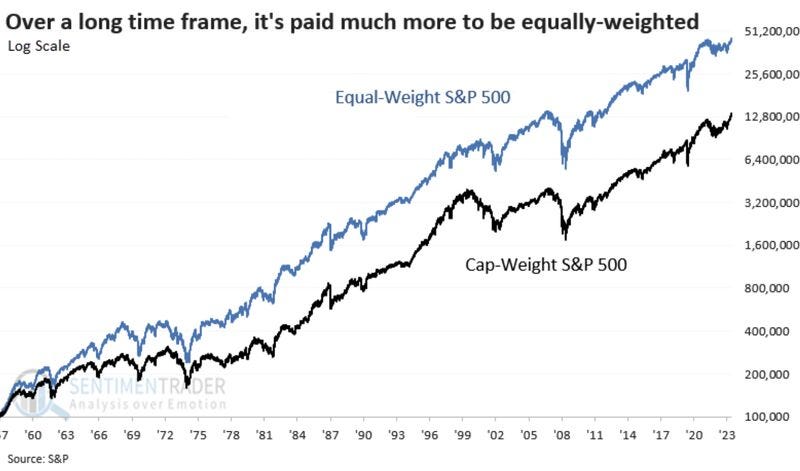
Source: @allocator_asset @jasongoepfert
REMINDER: Check out the new Education Section at Topdown Charts
Upskill and uncover useful indicators, concepts, and methods to help navigate risk and return across assets & across market cycles — Subscribe Free or bookmark the Education page to access current and future articles…
9. Not Top: Taking it from a different angle, keeping it cap-weighted but excluding the top 10 stocks has historically resulted in higher returns over the long-run vs plain cap-weighted. I suspect that this comes from the fact that market-cap weighted indexes will drift you into the most bubbly and overpriced stocks (which probably fall the most when the cycle runs its course).
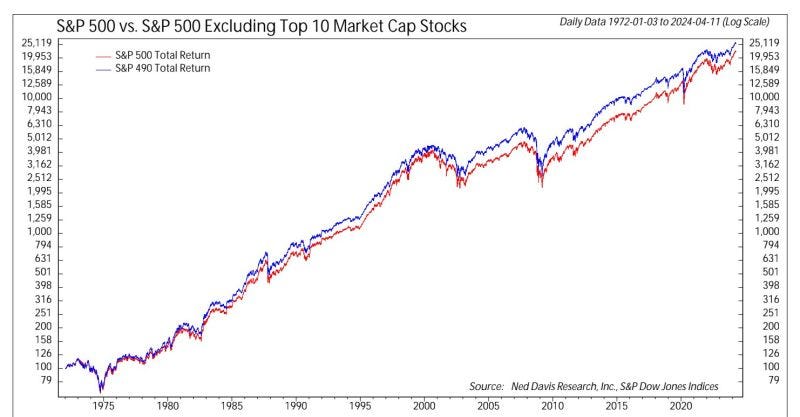
Source: Meb Faber
10. Getting Better at M&A? This chart from Bain shows companies are apparently getting better at M&A, especially serial acquirers. They suggest this is due to: shifting focus from cost/defense to growth/offense (scale to scope), better due diligence (tech enabled + more thoughtful), experience from just doing more deals, and avoiding big dumb deals (e.g. AOL/Time Warner). I suspect this is true, but I also can’t help but ponder if there is some odd effects like winning companies have more cash and creativity to do deals (selection bias), and 2000-2010 was not a great time in markets vs the 2010-2020 raging ZIRP bull (performance measurement cloudiness).
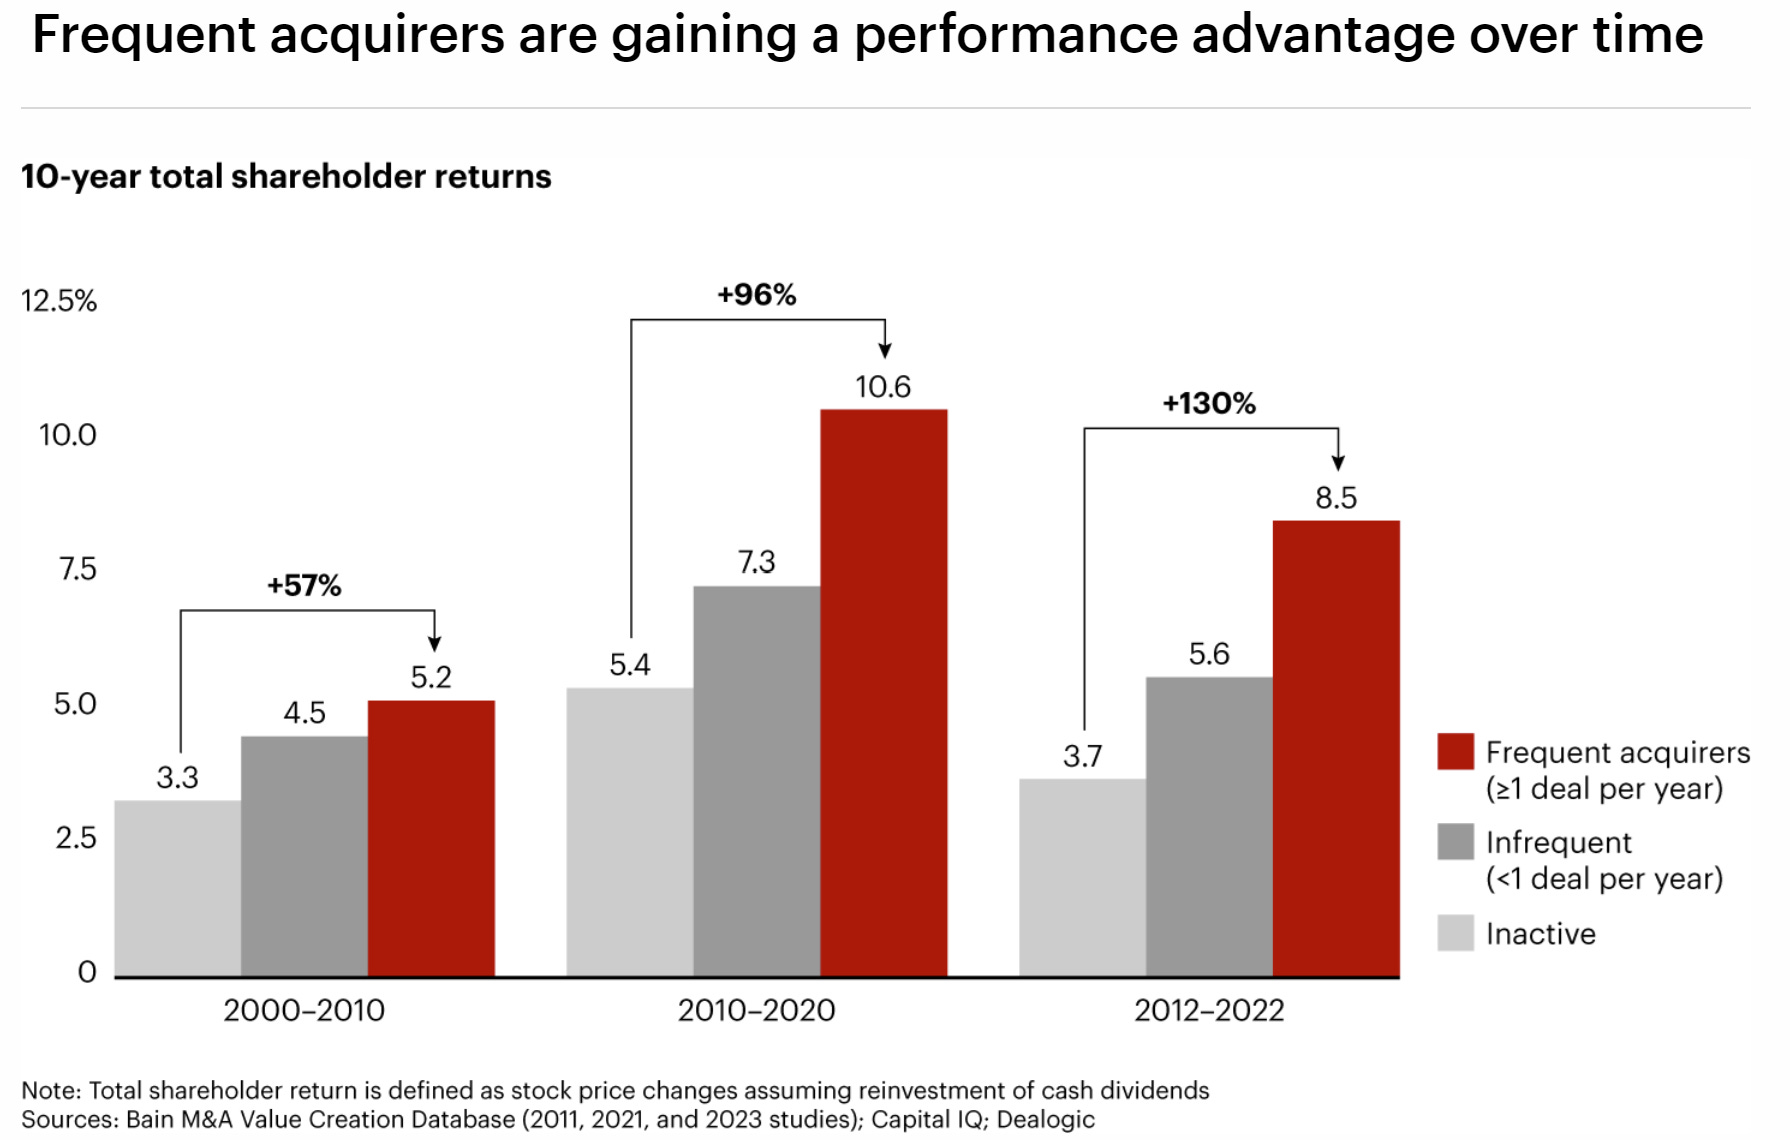
Source: @RTelford_invest
BONUS CHART SECTION…
S&P500 Effective Tax Rate trends — an end to the trend? (upgrade to paid to access)
Paid Subscriber Benefits:
Access to the Bonus Chart section (exclusive chart/theme/insight)
Access/Participation in the Comments Section (paid subscribers only)
Have your Questions Answered (by email or in the comments)
Quick+Responsive Customer Service (no issues unresolved)
Ad-free (no ads in the way, no marketing emails)
Upgrade to paid for instant access to these benefits and gain a greater level of insight, join a community of intelligent investors, and support the cause
Thanks and best regards,
Callum Thomas
Founder & Editor of The Weekly ChartStorm
Twitter: https://twitter.com/Callum_Thomas
LinkedIn: https://www.linkedin.com/in/callum-thomas-4990063/