

Welcome to the latest Weekly S&P500 #ChartStorm!
Learnings and conclusions from this week’s charts:
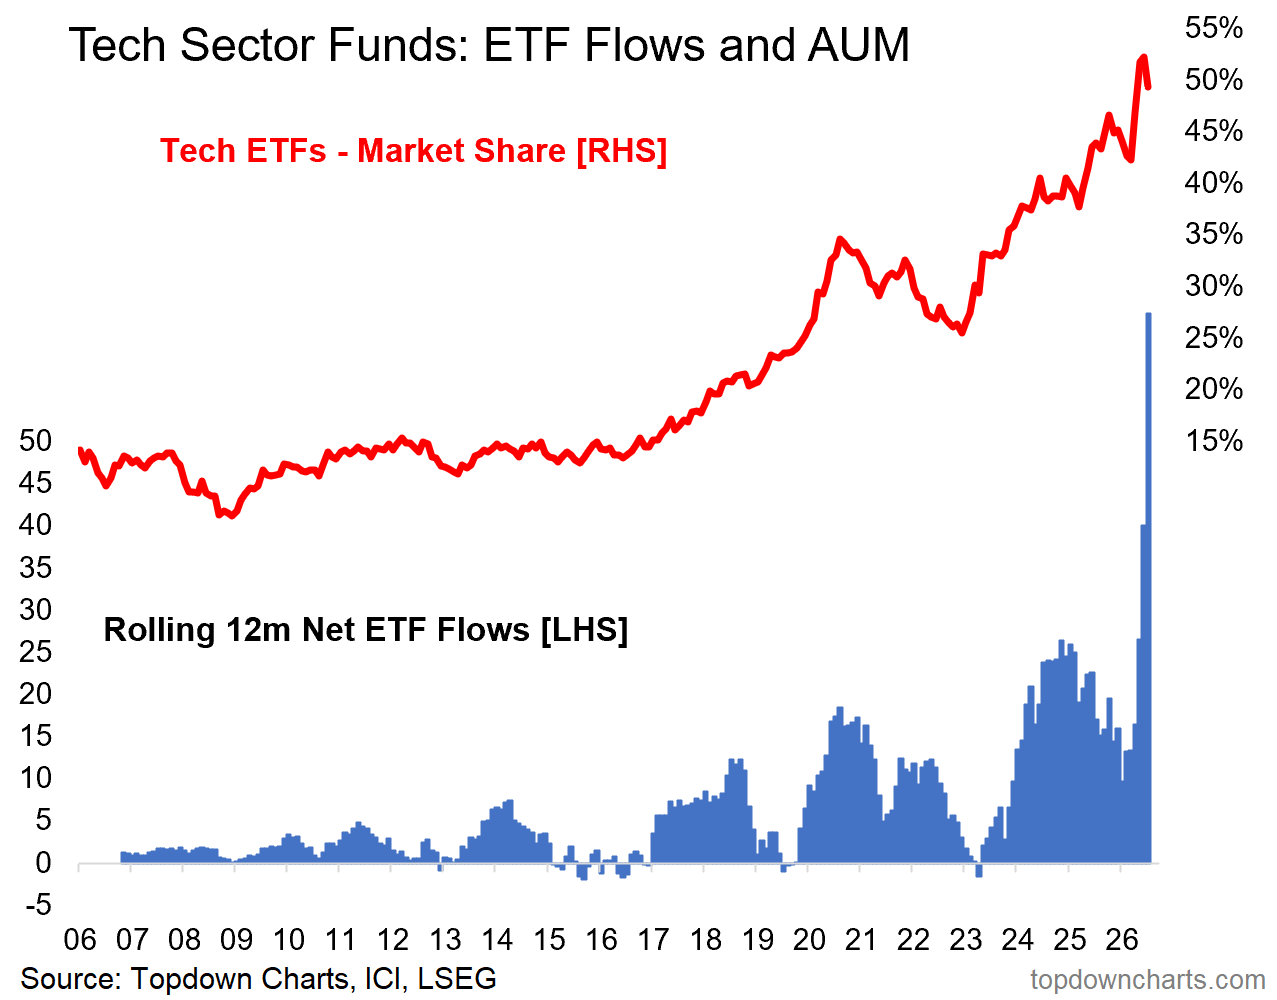
Tech stock ETF flows recently reached record highs.
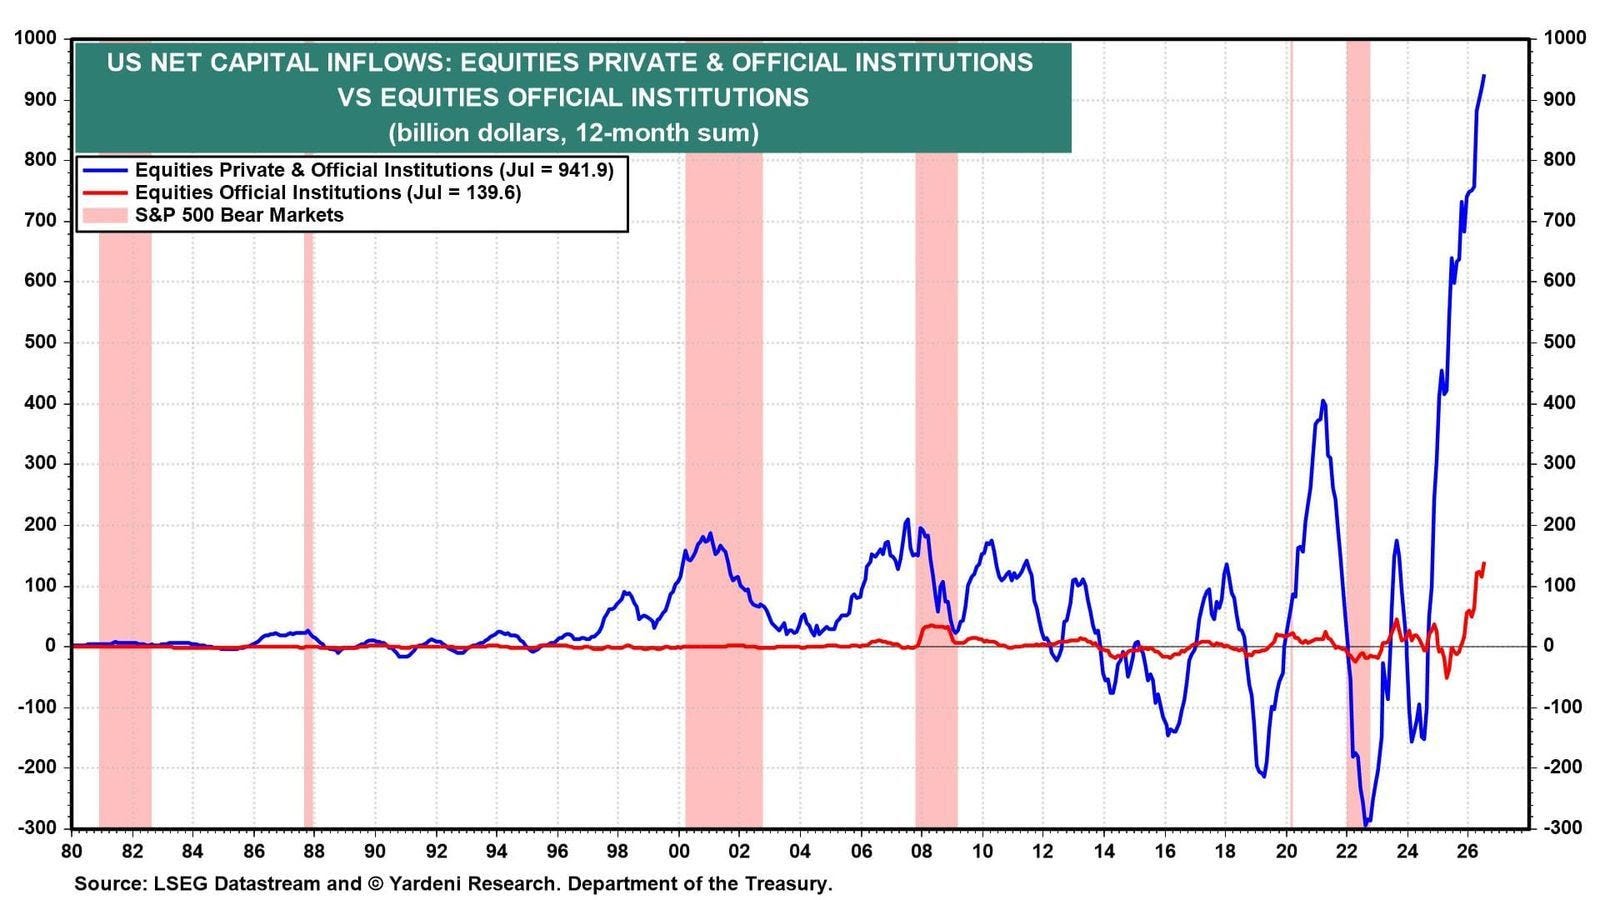
Foreign flows into US stocks are surging (record highs).
CEO confidence, ISM PMIs, and freight data are turning up.
Margin debt indicators are sounding a clear risk warning signal.
Much of the index are heading into a buyback blackout window.
Overall, there is a lot of good news on the earnings and economy front as a broader cyclical upturn gets underway. But there are still lingering macro/(geo)political risks and market warning signs that could derail this renewed upturn…
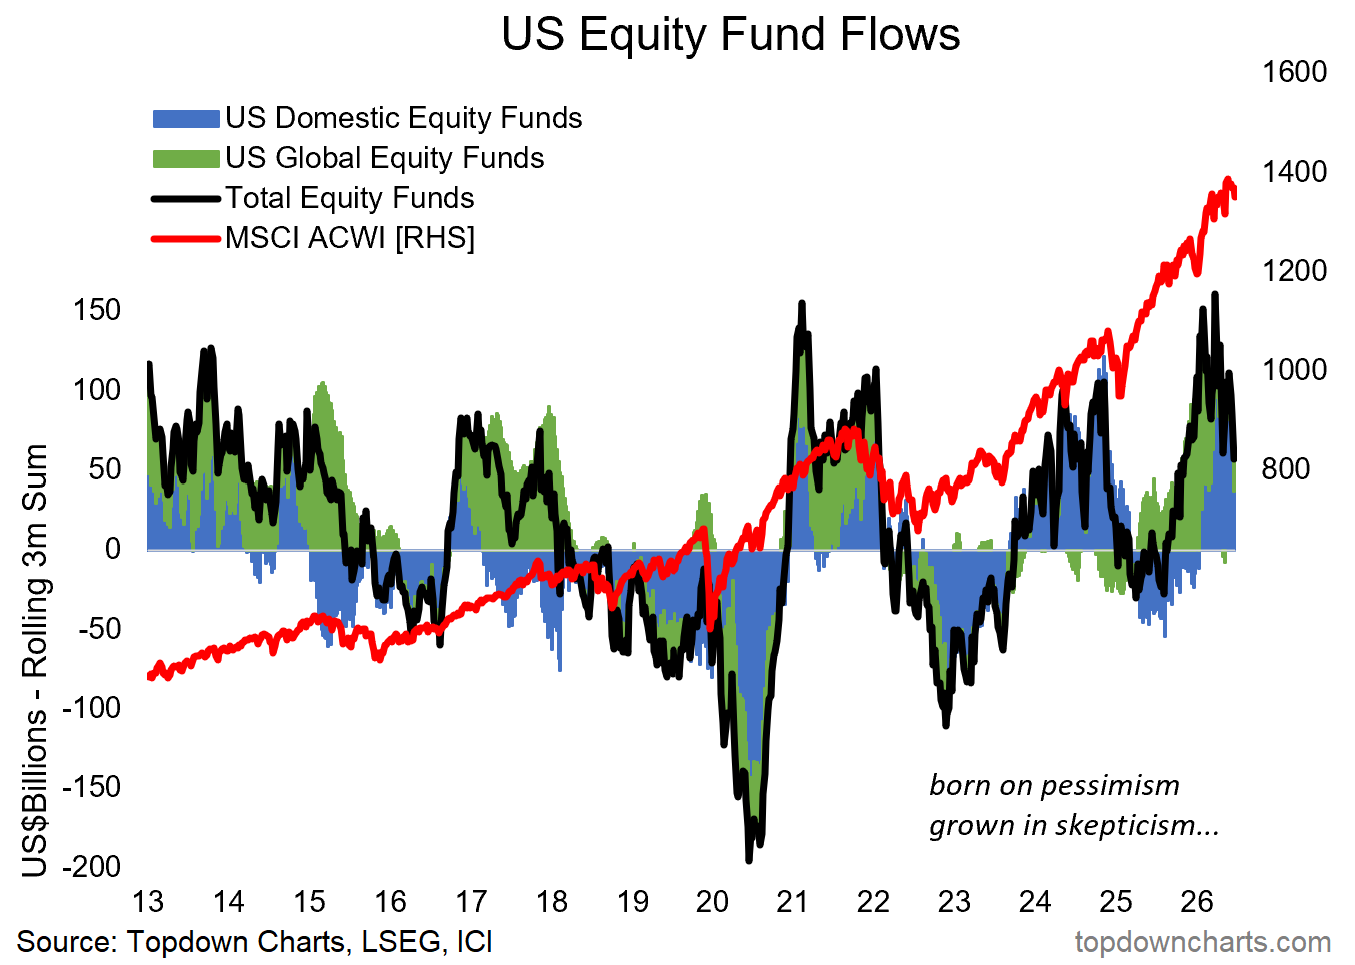
1. Fund Flows — US Equity Funds: first up is a check-in on flows. This chart reminds me of the saying by Sir John Templeton: “Bull markets are born on pessimism, grow on skepticism, mature on optimism, and die on euphoria”.
You can clearly observe those phases in the flows cycles in this chart, e.g. outflows throughout the 2020 rally, then frenzied inflows into the 2021 peak, and then outflows again through the beginning of the subsequent bull market.
And now? —looks like fading euphoria.
Source: Topdown Charts Professional
2. Fun Flows — Global: similarly, global investor buying flows into US stocks look to be in the euphoria stage; record highs.
Source: Yardeni via Daily Chartbook
3. Fund Flows — Tech Stocks: tech sector ETFs just recently witnessed their largest inflows ever, and now comprise around 50% of sector ETF assets under management. Investors the world over have a huge amount of confidence in the outlook for US stocks, to put it lightly.
Source: Topdown Charts
4. CEO Confidence: CEOs are also gradually becoming more optimistic on the outlook; this echoes the upturn we’ve seen in the ISM PMIs and global manufacturing PMI reacceleration.
