

Welcome to the latest Weekly S&P500 #ChartStorm!
Notes from this week’s charts:
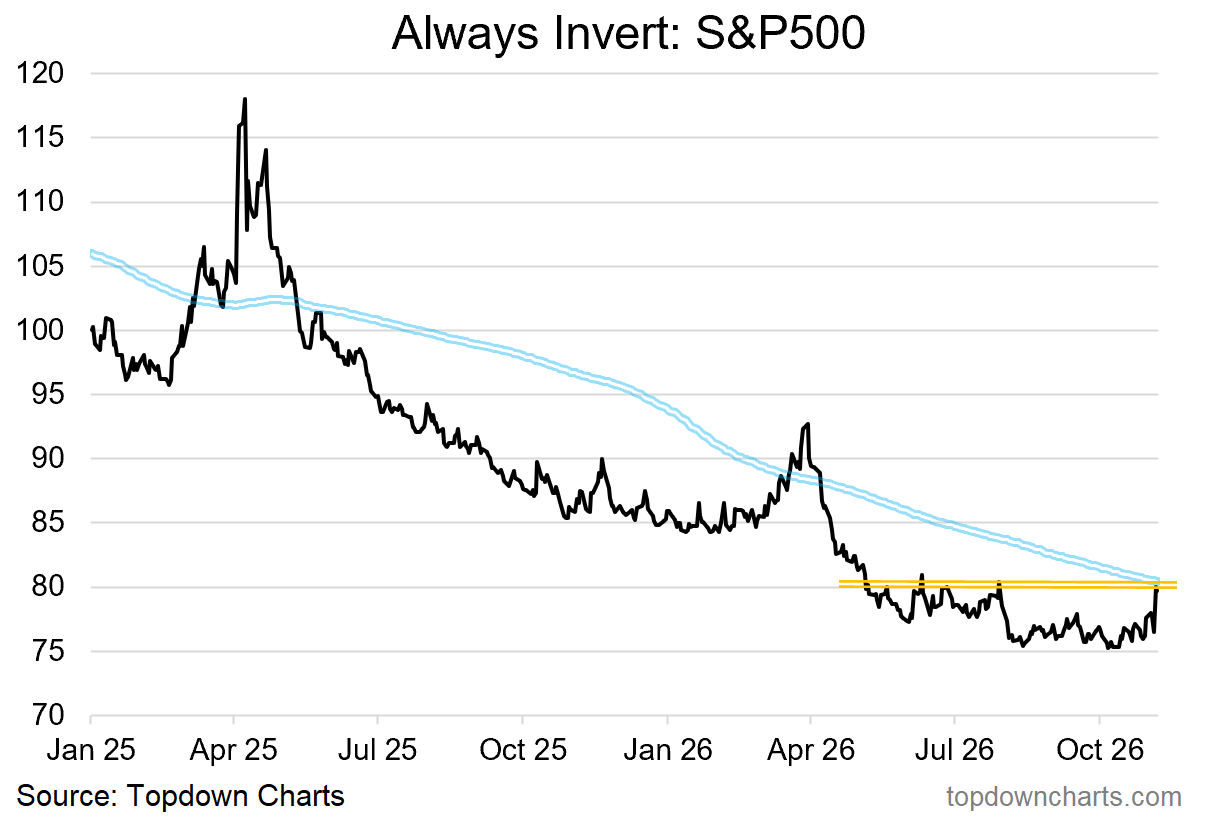
The S&P500 is currently testing critical support levels (make-or-break).
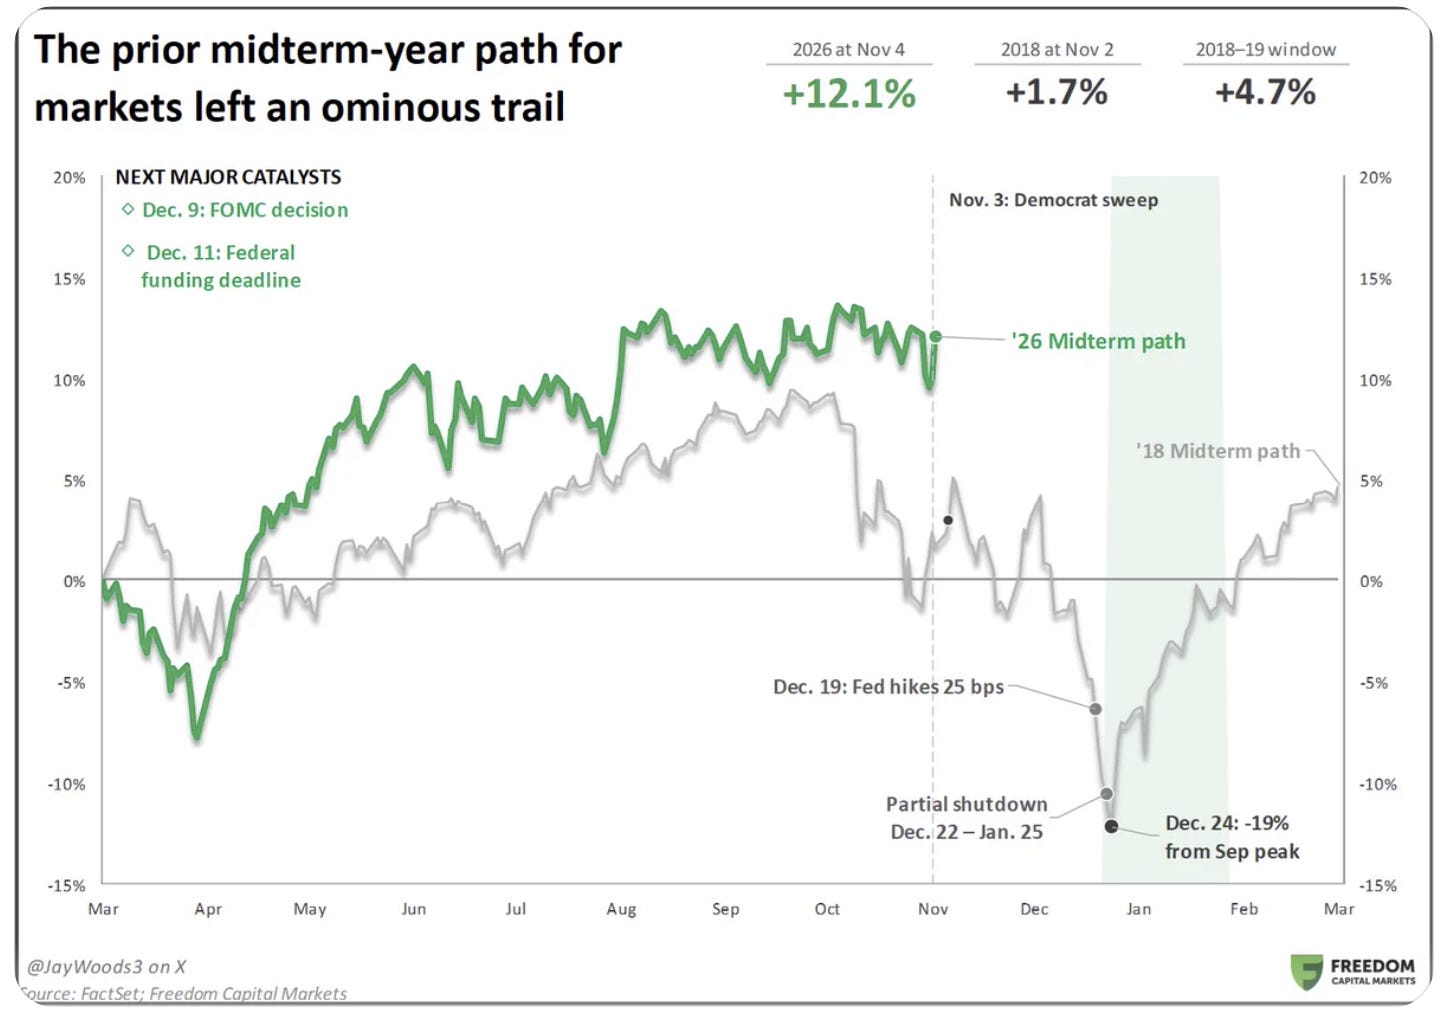
Numerous (geo)political/macro circumstances are echoing the late-2018 setup.
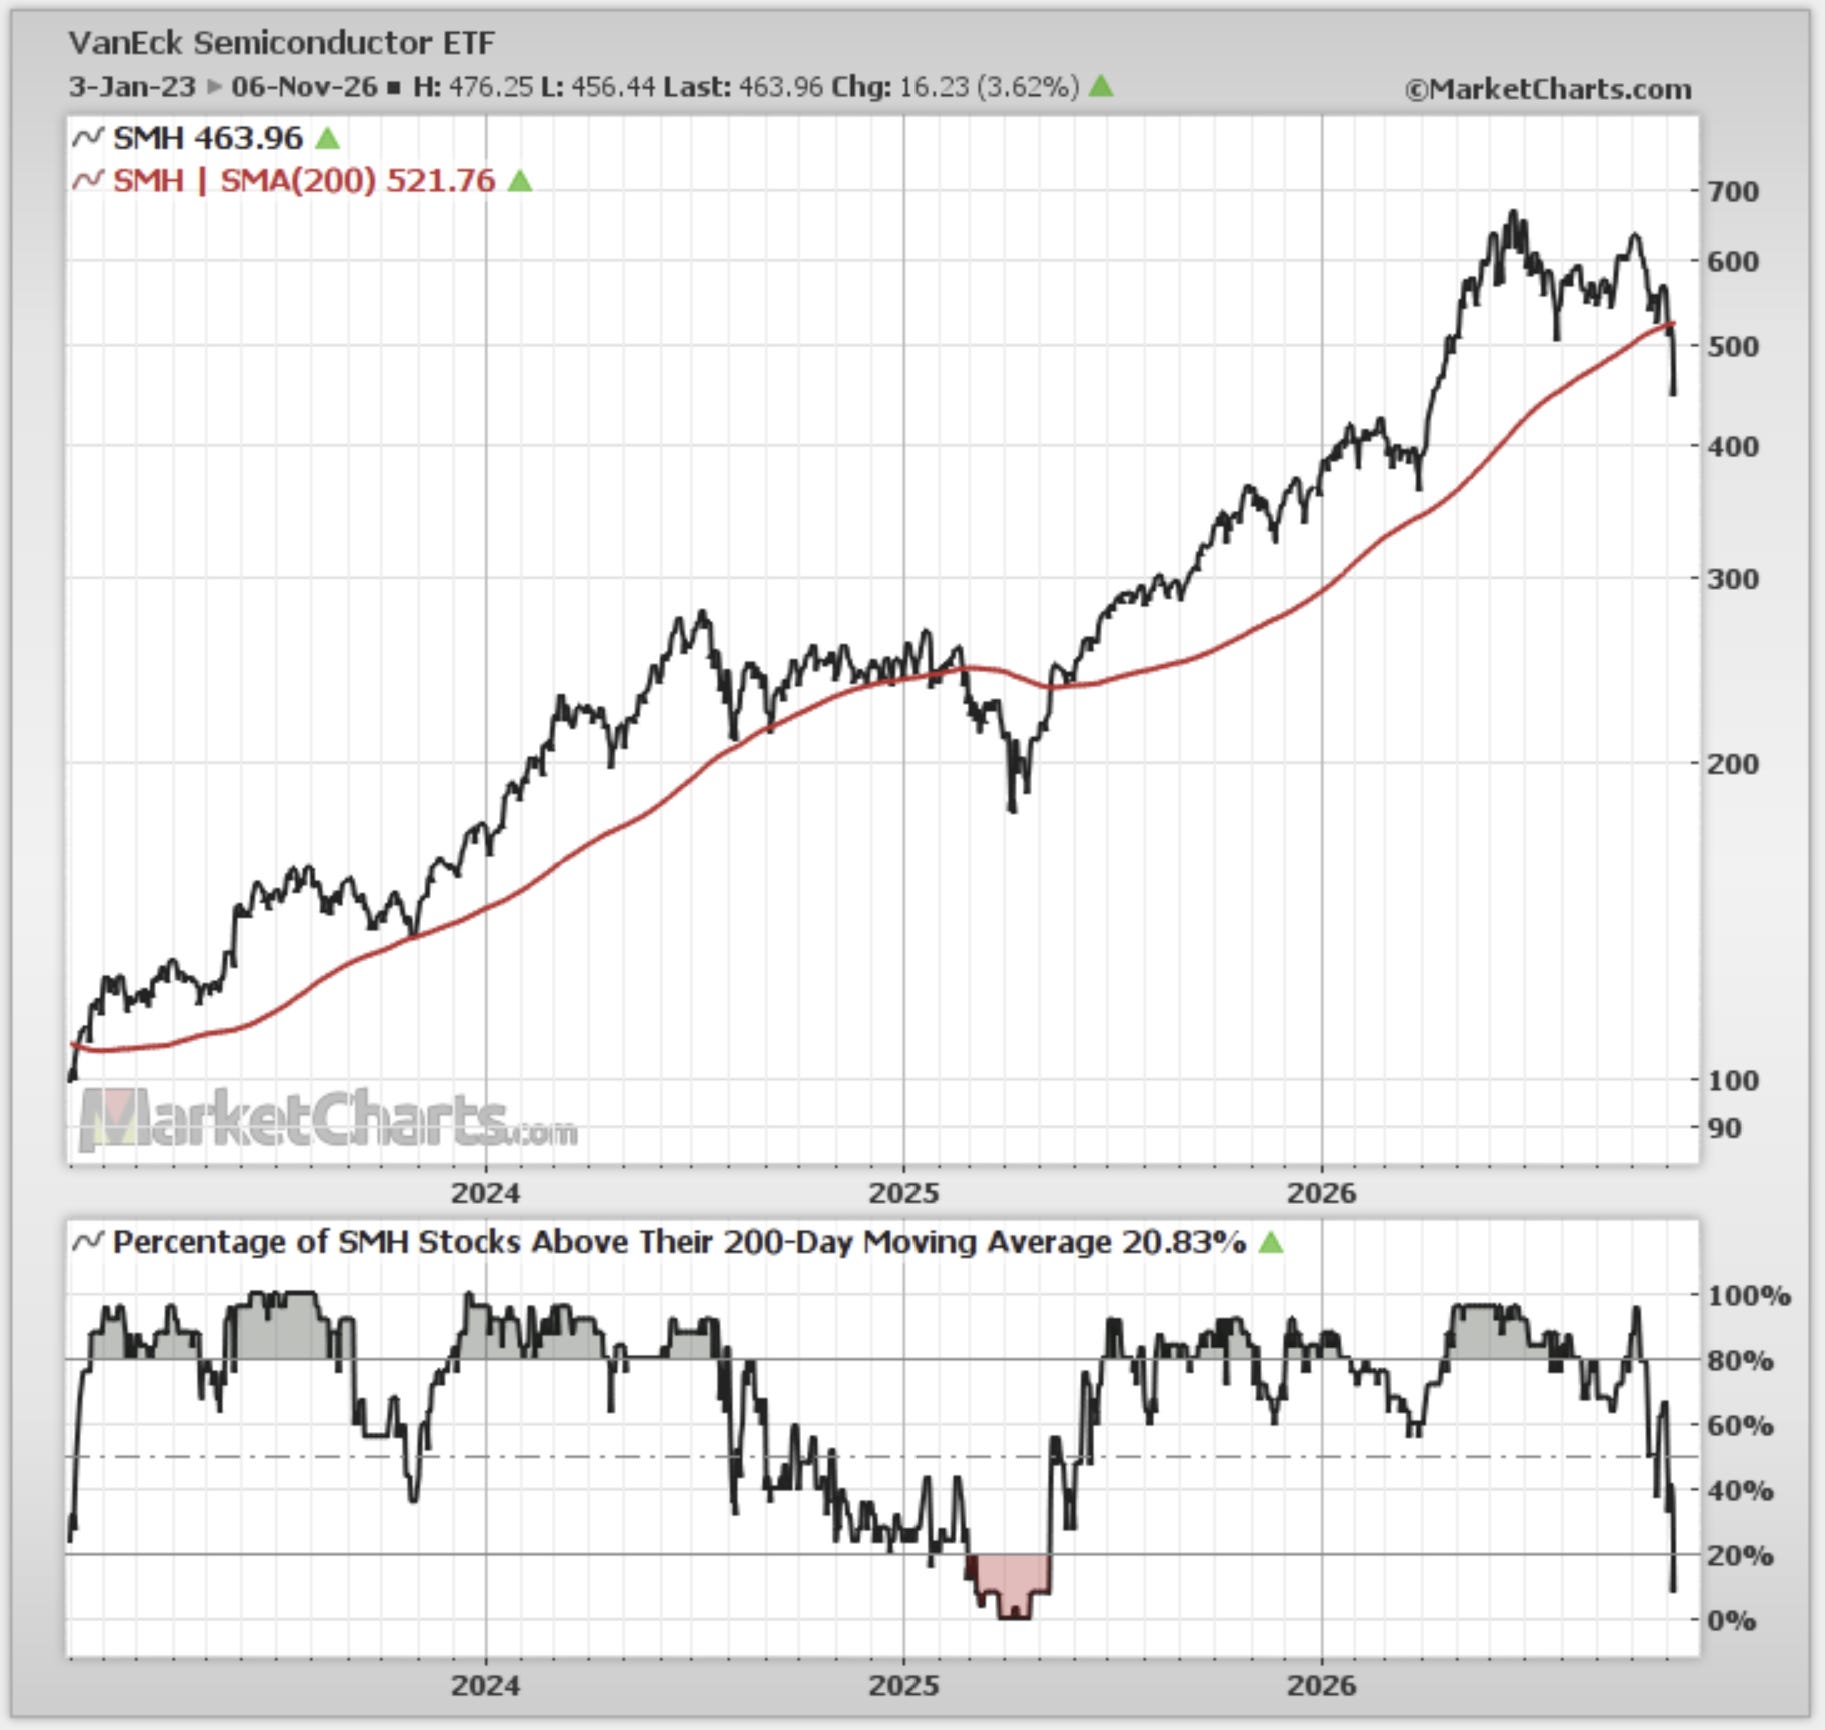
Semiconductor stocks are in a short-term downtrend (lower highs, lower lows).
Semis & Tech sector forward PE ratios are looking cheap (but maybe a bad thing).
Leveraged traders are buying the dip (into a seasonal 6-month strong patch).
See below for the full set of charts and details behind these points + the [new] market outlook section at the end for my latest assessment.
1. Inversion Confluence: kicking off this week with an upside down chart for an upside down world. Currently the S&P500 is down almost -6% off the October 6th peak. That has the -inverted- S&P500 looking rather bullish, but for it to “break out” (not a good thing) it would need to clear the confluence of: short-term resistance + the 200-day moving average. This week will be literally make-or-break.
Topdown Charts Professional
2. Deja vu all over again: for the bears it couldn’t get much better or simpler than this — a possible replay of 2018 (when the previous Trump presidency also saw R’s lose the House to D’s).
Back then it was a combination of Trade War, Fed Rate Hikes + Government Shutdown that sank markets. This time? Similar stuff: possible Fed rate hike in Dec, Federal funding deadline, possibly more on trade and geopolitics (along with the recent rattles in AI).
Source: @JayWoods3
3. Semis Slip'n Slide: speaking of which, semis are now in a downtrend (lower highs and lower lows) + they have breached the 200-day moving average (with widespread weakness). This one looks like it gets worse before it gets better with the logical next line of support around 400 for SMH.
Source: MarketCharts.com
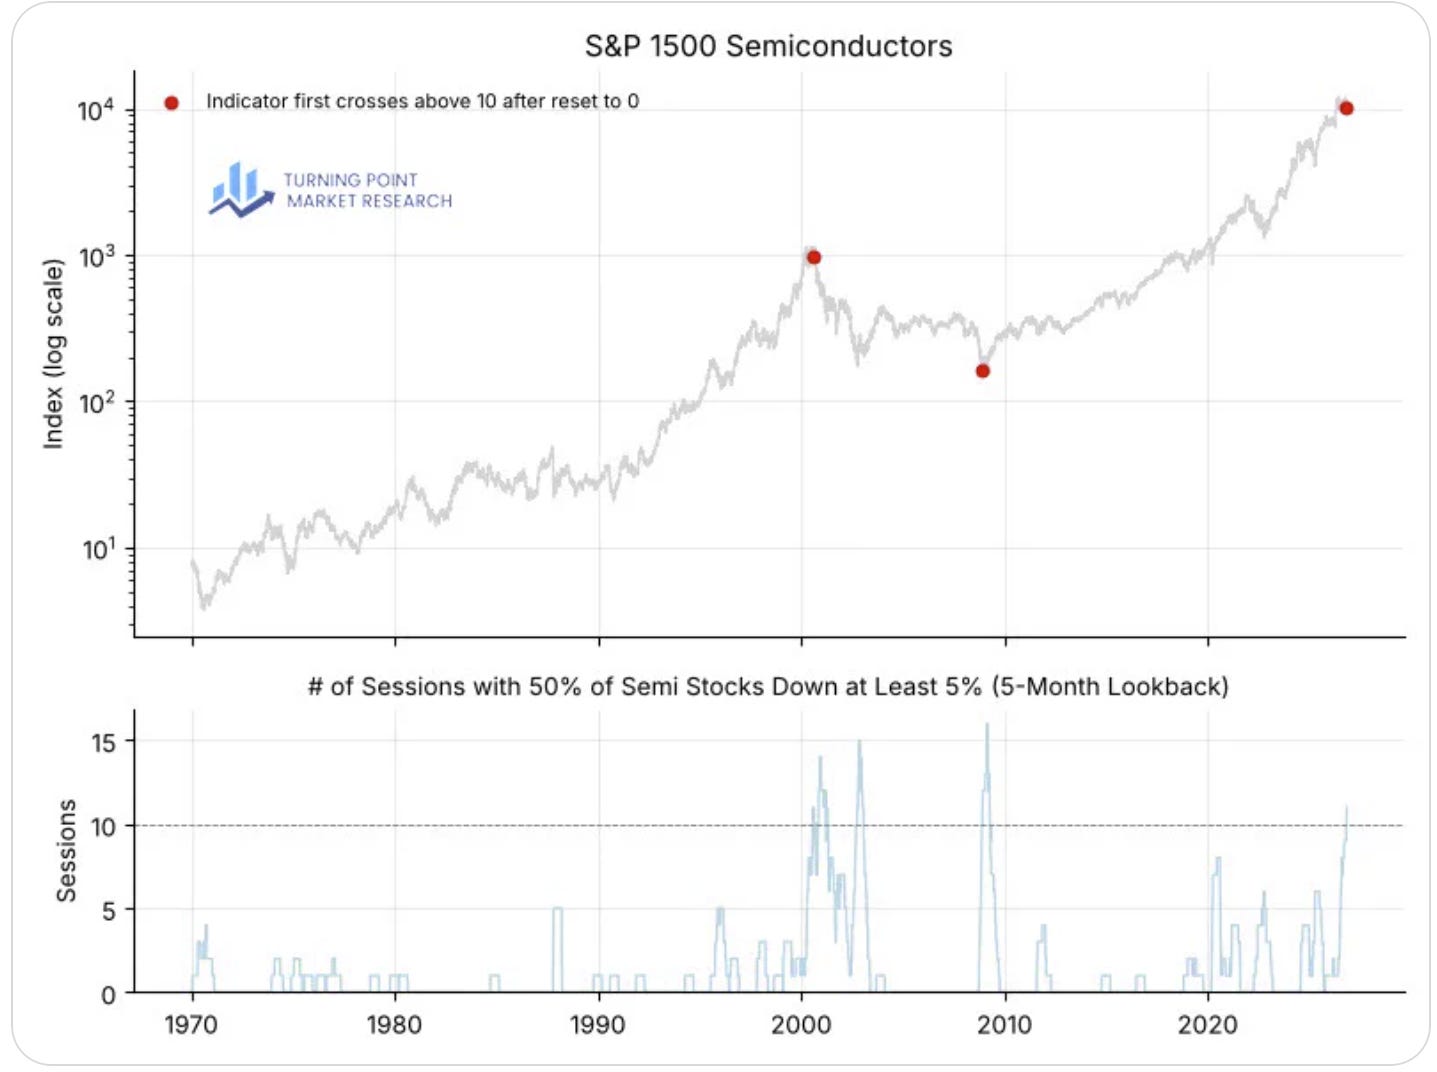
4. Oddly Specific But Ominous: so this oddly specific set of conditions [i.e. when the rolling 5-month count of days when semis fell -5% or more goes above 10] has only shown up twice before.
i.e. July 2000 and December 2008 — the former marked the peak of the dot com bubble, the latter came on the heels of a global financial crisis and stockmarket rout. Today looks much like the former, not the latter. Hence this is an ominous signal.
Source: @DeanChristians
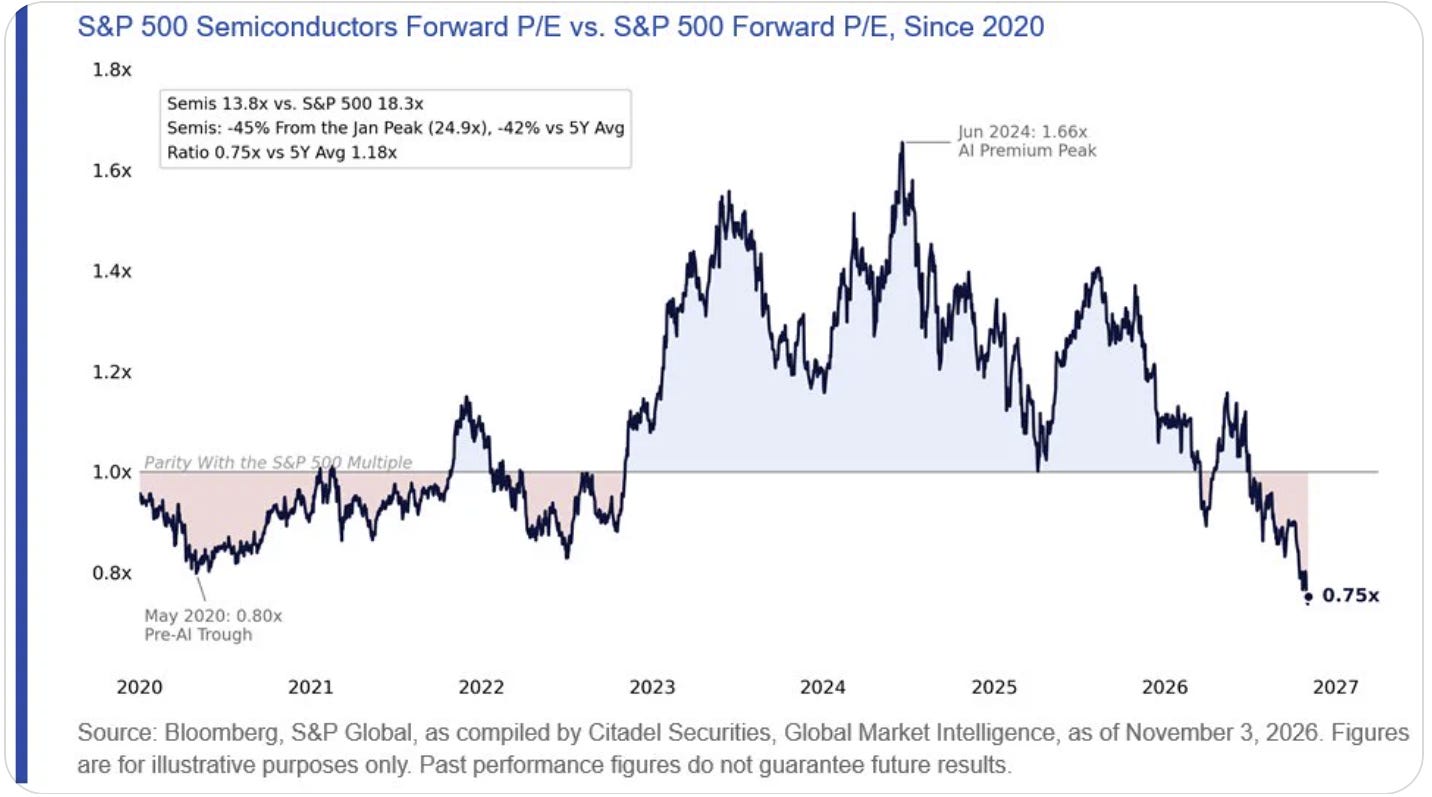
5. Semi Relative Value? You could argue this chart is a bullish thing because semis are cheap vs the S&P500 and this represents a buying opportunity (and maybe it does). But you could equally argue that because we are looking at forward PE ratios that it represents a total loss of confidence in future earnings and a sunset on the initial phase of the AI boom/bubble.
Source: @negligible_cap
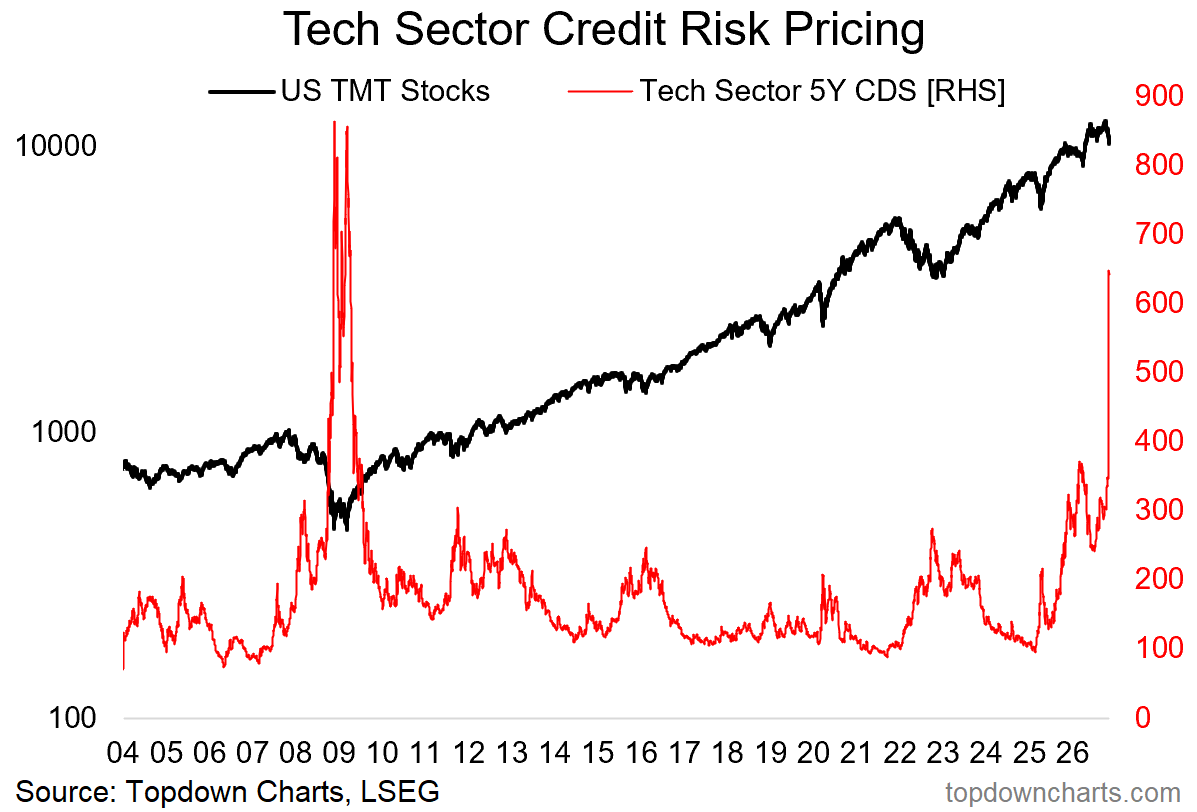
6. Giving Credit: tech sector CDS pricing has gone from rising to spiking post-midterms. There is a mini panic underway in tech stocks as AI stock bubbles bursting in China and Korea have begun to ripple across to the USA, along with concerns that the Dem sweep may present a less friendlier regulatory backdrop for the AI theme.
But one curious thing to note is that this indicator has now reached the highest point since the global financial crisis. Sign of things to come? (…or Sign that markets are overreacting?)
Source: Topdown Charts Professional
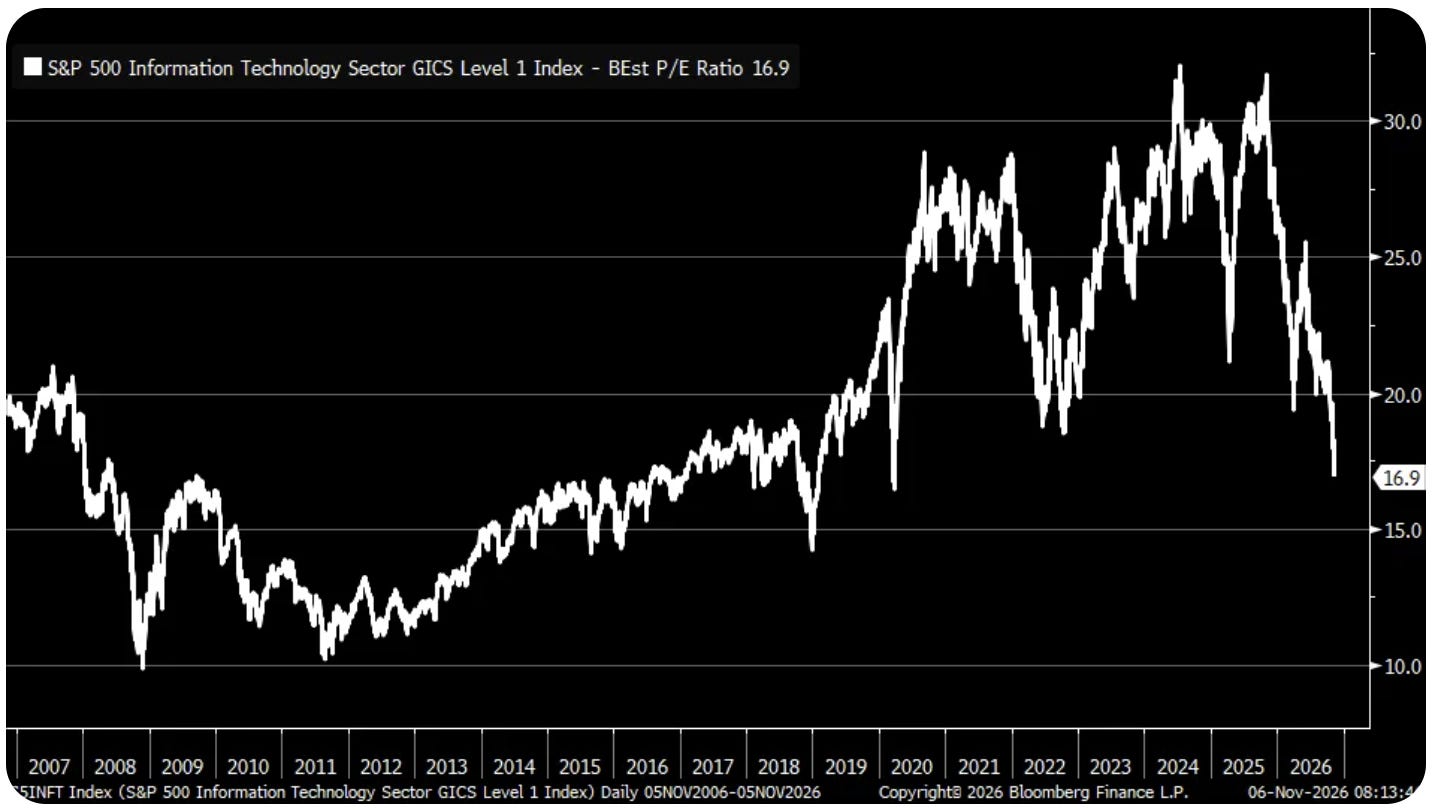
7. Tech Cheap? back on forward PE ratios, Tech looks cheap on a forward PE basis — as cheap as March 2020. Three thoughts on this: a. it could get cheaper (if stocks do repeat history and correct further into Dec); b. it could be a false signal (if earnings disappoint against euphoric AI-hype driven expectations); c. it could be simpler than that and maybe it is just a buying opportunity and we ought not to overthink it (but also not throw caution to the wind; maybe take a risk-controlled punt).
Source: @KevRGordon
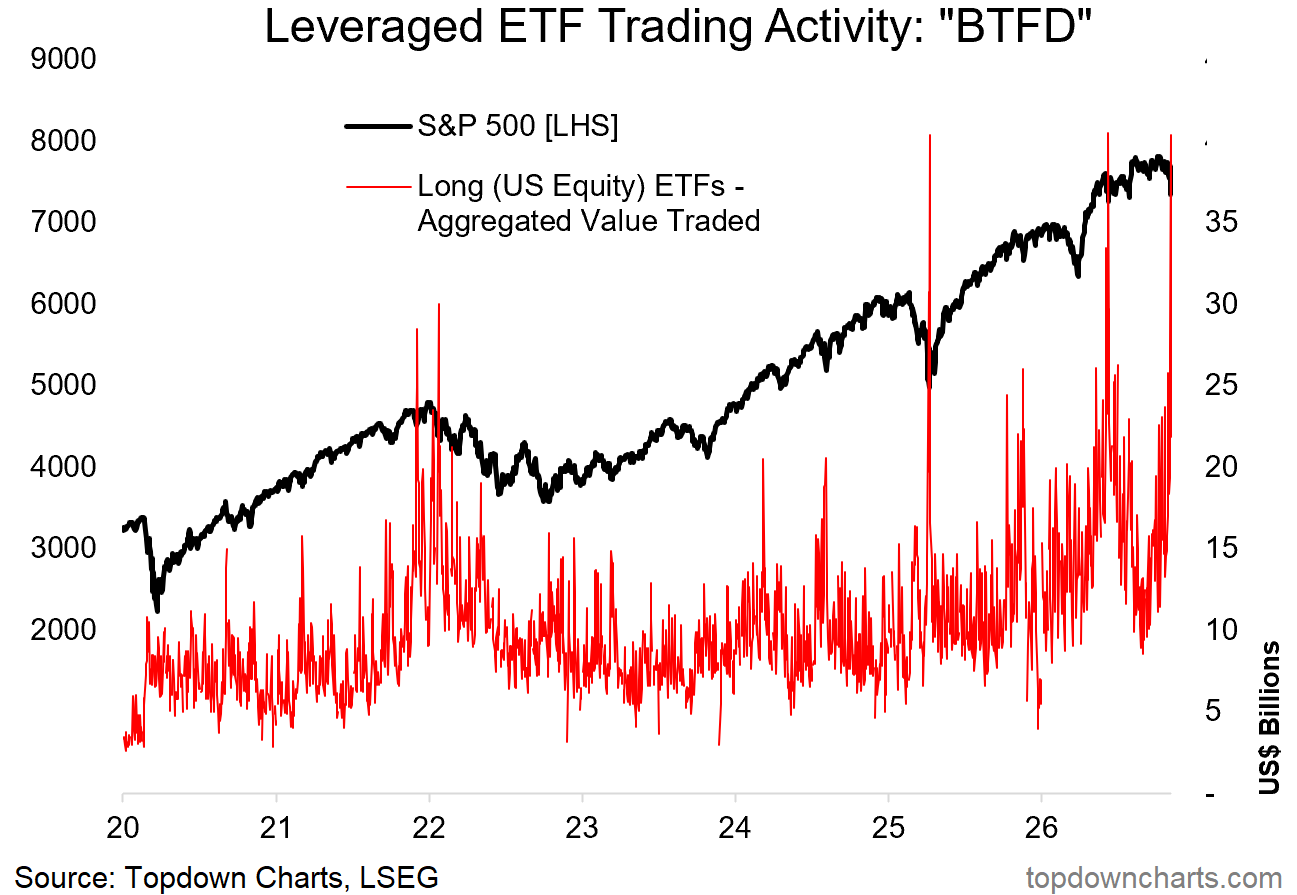
8. Dip-Buyers Deploy: looking at leveraged US equity ETF activity the dip buyers are already out in force. This group best nailed it in early-2025, and did OK this year too, but informatively; they got it quite wrong in the big picture headed into 2022.
Source: Topdown Charts Research Services
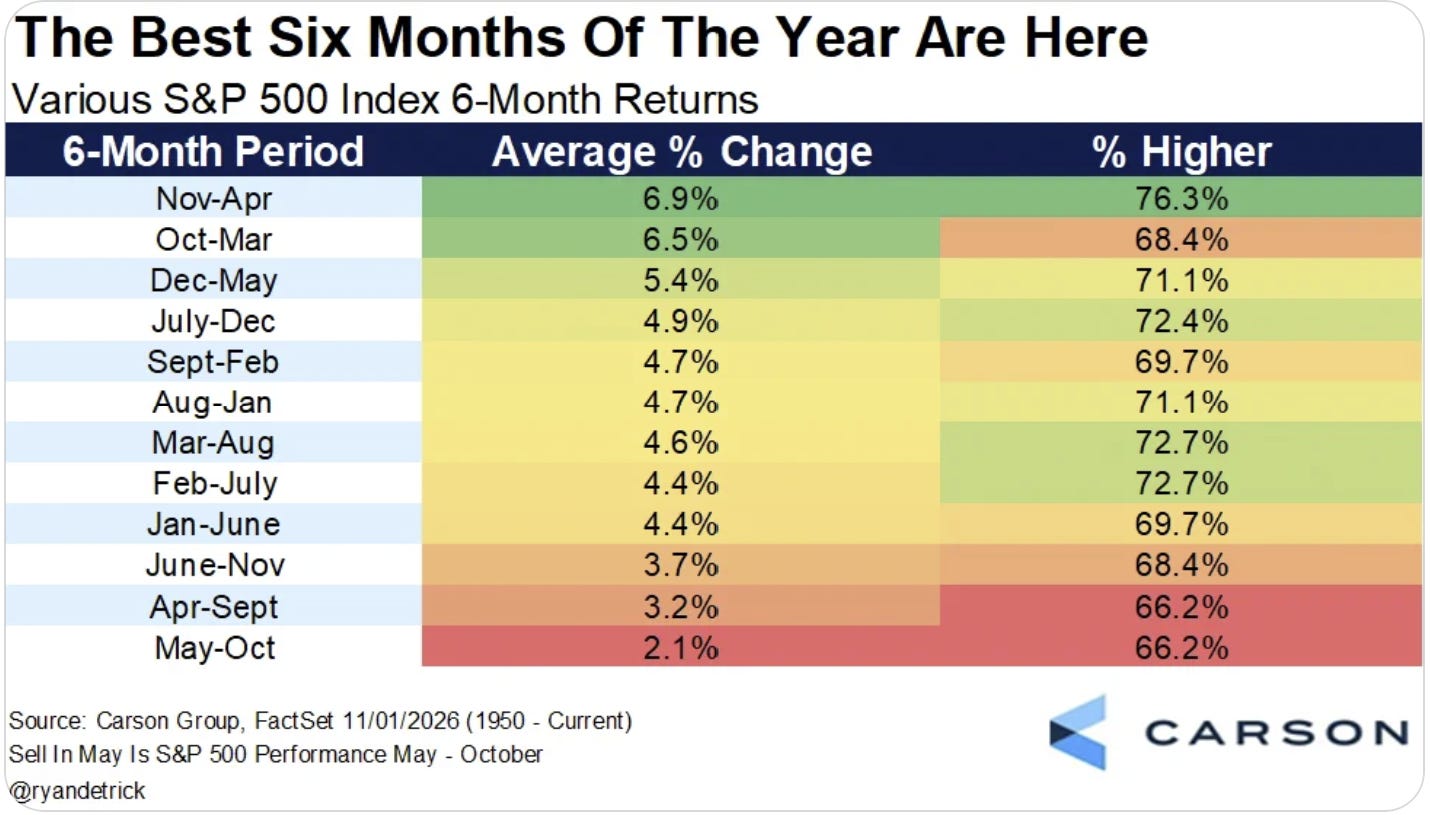
9. Seasonal Sixes: at the risk of overdoing it on seasonality charts lately, we’re heading into what is typically the best 6-month period for the stockmarket (and by the way, maybe lengthening-up the timeframe is a good idea at this point vs the day-to-day minute-to-minute ticks).
One thing I would note or caution on this one: positive 6-month forward returns overall could still involve a major excursion to the downside (during).
Source: @RyanDetrick
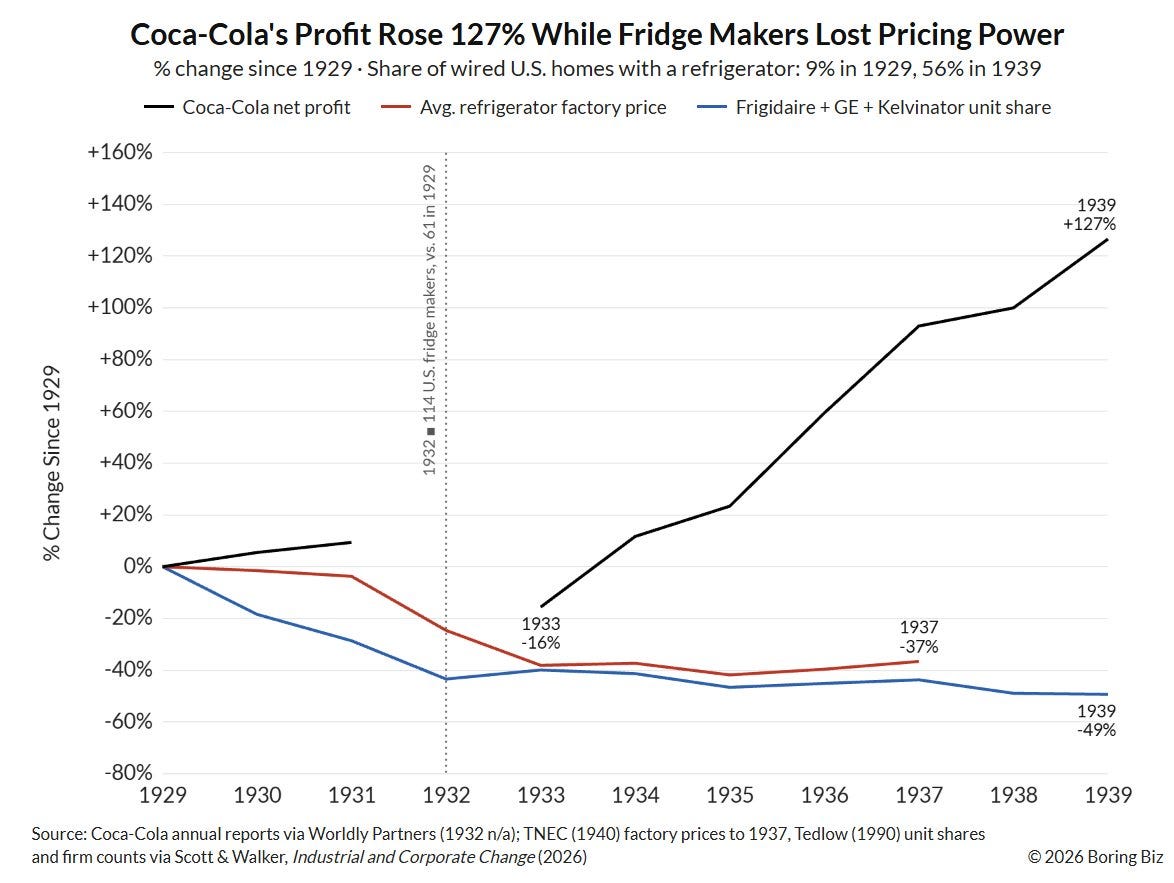
10. Fridges & Coke: here’s an interesting potential parallel to the AI age. It turns out that one of the biggest beneficiaries of the mass adoption of fridges was not fridge-makers, but Coca-Cola: “After fridges became a common household appliance, the biggest benefactor was not the manufacturer companies. It was actually Coca-Cola, who took advantage of the new technology to shift from local soda fountains to bottled and canned products.”
And you see this phenomenon play out over and over. Industrial and manufacturing firms benefited more from electrification than electrical companies, software and services benefited more from the internet than telecom companies, Sears vs Transcontinental Railroad (mail order catalogs), Uber vs GPS & Smartphones, to name a few.
The same will likely be true for AI — and we probably don’t (can’t?) even know just yet who or what will be the biggest beneficiary from an economic value/profit or other metric standpoint yet. But it’s definitely worth thinking about.
Source: @BoringBiz_ via Off The Charts
Thanks for reading, I appreciate your support!
US Stockmarket Outlook: 5-factor framework
I maintain my previous assessment of: expensive valuations + consensus bullish sentiment + heavy exposure to equities + rate hikes = the background risk setup is dangerous. While earnings/economy is still supportive, and the trend is still up —the technicals look a little tenuous right now. So I would be taking a more cautious stance.
Overall stance: on-watch (increasingly risky outlook).

The table above uses the “Topdown Charts 5-Factor Framework” for analyzing macro and markets to give an overall assessment on the US Stockmarket.
Factor in Focus — Positioning
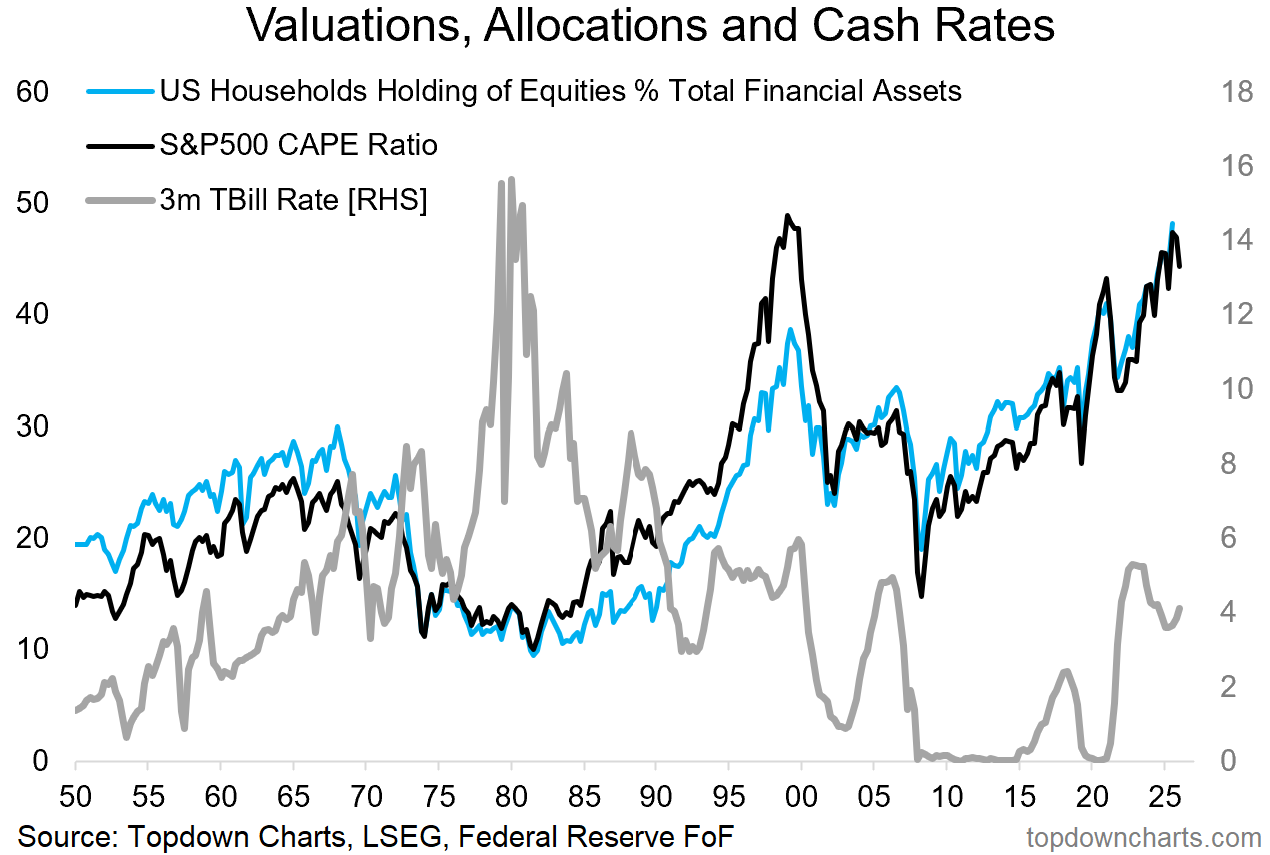
While sentiment has been swinging around (surveys are on balance still net-bullish), positioning remains heavily skewed to risk assets.
The go-to chart for me is valuations, allocations, and cash rates. The current setup is echo-maxxing the dot com peak: equity allocations have run up to a record high, valuations likewise reached similar levels, and tbill rates are ticking up again following a period of minor easing.
Then take a look at the defensive side.
Investor allocations to cash and bonds are at cycle lows, and defensive sector equities’ market cap weighting is ticking up from record lows.
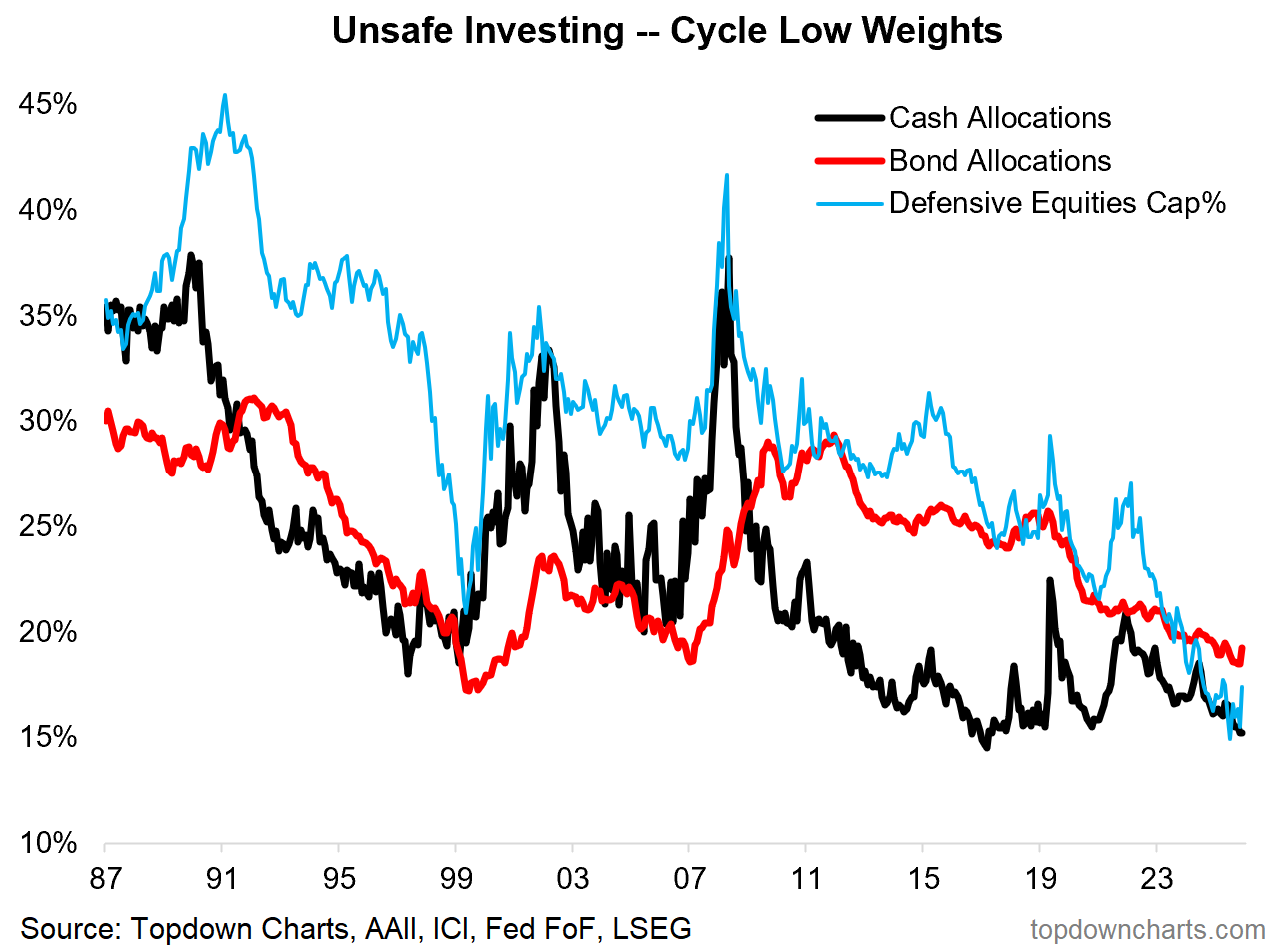
These are contrarian signals, long-cycle signals, and a sign that your average investor is not prepared for the next downturn (and hence a reminder to review and rethink asset allocations).
—
Best wishes,
Callum Thomas
Founder & Editor of The Weekly ChartStorm
and Head of Research at Topdown Charts
Connect: LinkedIn | Twitter/X | Substack
In case you missed it, also see last week’s edition:

Looking for deeper insights + global multi-asset investment ideas? Check out Topdown Charts Professional for a flow of ideas, risk alerts, and macro insights to help make better decisions with confidence.

.
Your CDS chart appears wrong